Publishing your App isn't the end of the story. Once it's live and people are using it, you'll want to understand how it's performing. That's what the Analytics tab is for.
The Analytics tab helps you monitor the performance of your published App, so you can understand how it's being used and quickly investigate issues as they arise. You can filter the data by time range to spot trends or dig into specific periods.
Here's what you can keep an eye on:
Viewers. See total and unique viewers to understand adoption and spot your most engaged users. For each App, you can see details like user name, email, view count, and when they last opened it.
Endpoint activity. Track endpoint invocations and runs, so you can see how often your App is talking to its underlying stories.
Success and failure rates. Keep an eye on how reliably your App is running, and catch problems early.
Routes. See visit breakdowns for specific pages of your App. (Remember multi-page routing from the earlier module? This is where those individual routes get tracked.)
Together, these insights help you understand adoption, monitor your App's health, and catch issues before they become bigger problems.
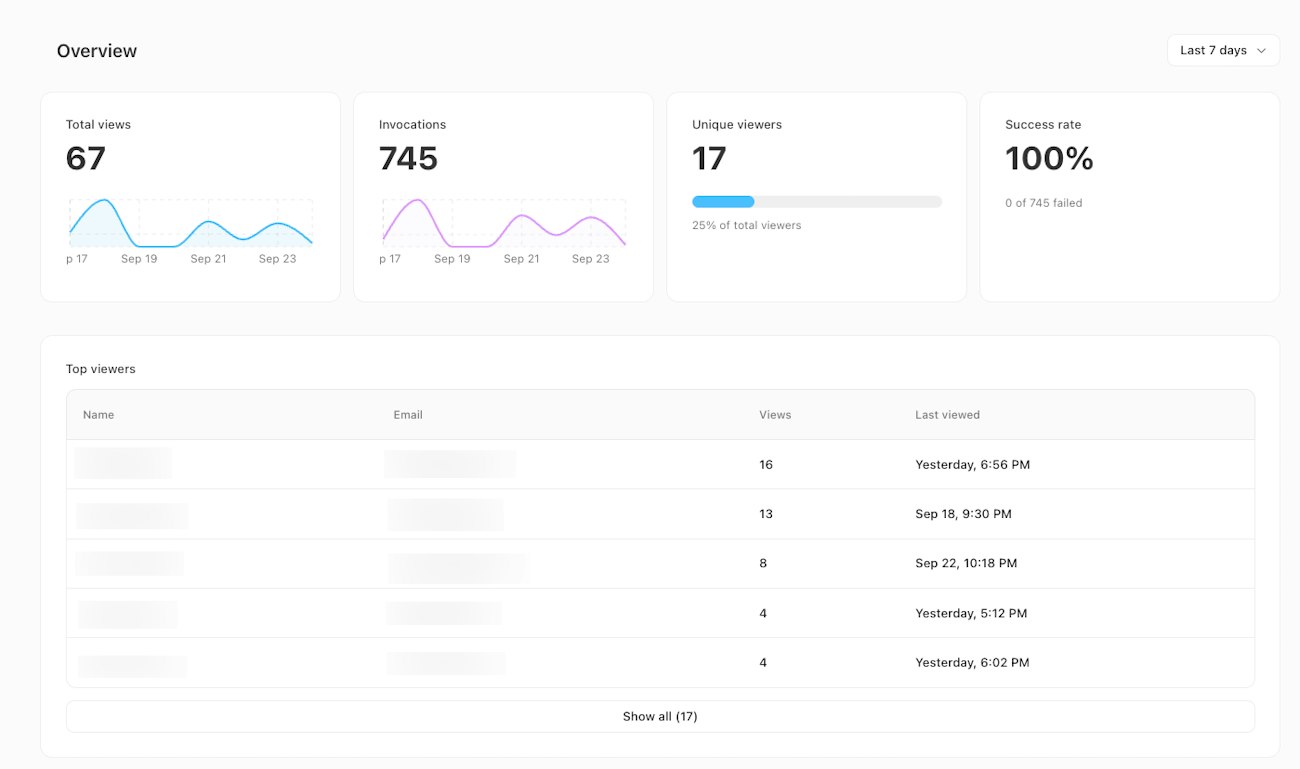
The Apps Analytics tab.
You can also query your App's analytics directly from the conversation panel in the App builder. For example, you can ask Workbench to help you debug a past endpoint failure or summarize usage patterns, and it will pull the relevant analytics data into the conversation. This is a quick way to investigate issues or check on your App's health without leaving the builder.