System diagnostics
System diagnostics helps self-hosted tenant admins troubleshoot a Tines Stories installation from inside the application.
Use system diagnostics to run health checks, investigate common configuration issues, inspect key subsystems, and collect information to share with your infrastructure team or Tines support.
Requires Tines v41.1 or later.
Who can use system diagnostics
System diagnostics is available to tenant admins on self-hosted Tines Stories deployments.
Open system diagnostics
To open system diagnostics:
Sign in as a tenant admin.
Go to Settings.
Under Self-hosted, select System diagnostics.
System diagnostics has two tabs:
Troubleshoot: Run health checks and debug tools.
Configuration: Review active self-hosted configuration values.
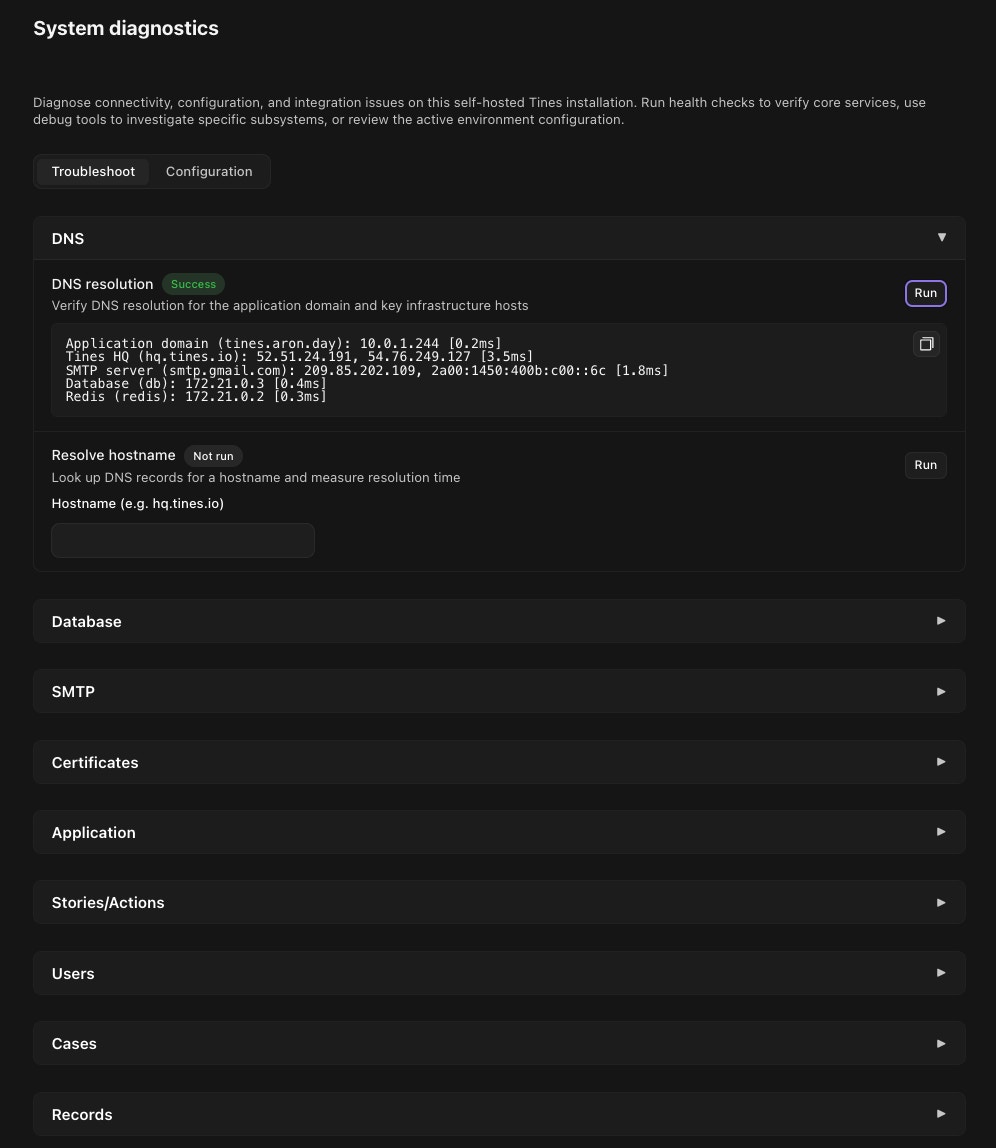
Run health checks
The Troubleshoot tab includes health checks for core parts of your Tines Stories installation.
You can use these checks to verify:
The Tines Stories application container is running and responding.
PostgreSQL, Redis, and Sidekiq are reachable.
The database has the required permissions, extensions, and session settings.
DNS resolves for important hosts, including your application domain, SMTP, PostgreSQL, and Redis.
The installation can connect to Tines Stories HQ for telemetry. This connection is optional and is not required for Tines Stories to function.
The largest PostgreSQL tables, to help identify storage-heavy tables.
Each check shows a status after it runs:
Success means the check completed without finding an issue.
Error means the check found a problem or could not complete.
Not run means the check has not been run yet.
Running means the check is currently in progress.
Use debug tools
The Troubleshoot tab also includes debug tools for specific areas of the application.
Available tools can help you inspect:
Users
Stories and actions
Cases
Records
SMTP configuration and email delivery
DNS lookups
Database status and pending migrations
SSO certificates and TLS certificate chains
Some tools run immediately. Others ask for input first, such as an email address, hostname, port, certificate, or private key.
Only run tools that are relevant to the issue you are investigating. Some outputs may include operational details about your tenant, configuration, or infrastructure.
Review configuration
The Configuration tab shows active self-hosted environment configuration values that are safe to display in the app.
Sensitive values, such as passwords, tokens, secrets, credentials, and private keys, are obscured before they are shown.
From this tab, you can:
Load the current configuration.
Copy the configuration as JSON.
Download the configuration as a JSON file.
Before sharing downloaded or copied configuration, review it to make sure it is appropriate for the recipient.
Share diagnostics with support
When working with Tines support, you may be asked to run specific checks or tools and share the output.
To share a result:
Run the relevant health check or debug tool.
Copy the output from the result.
Review the output for sensitive or environment-specific information.
Share it through your approved support channel.
For configuration details, use Copy as JSON or Download as JSON from the Configuration tab, then review the file before sharing.
Troubleshooting access
If you do not see System diagnostics in settings:
Confirm that you are signed in as a tenant admin.
Confirm that you are using a self-hosted Tines Stories deployment.
Confirm that your Tines Stories version supports system diagnostics.
Contact Tines support if the page should be available but is not visible.