For transparency and troubleshooting, you can view the raw JSON input and output for any tool execution. This helps when you want to understand exactly what data was sent to a tool, debug why something didn't work as expected, or see the complete response from a tool.
To view JSON, look for the pencil icon next to tool executions in your conversation. You can also click View story run from there to see the full story run details.
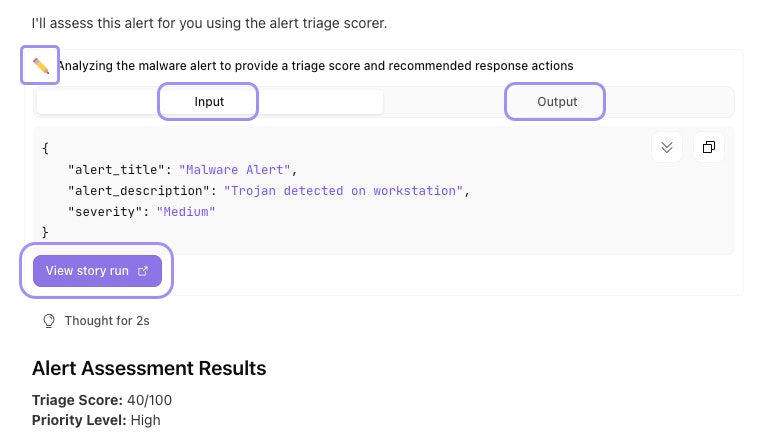
An expanded tool execution in a Workbench conversation, showing the raw data sent to and returned from the tool.