
How will you make sure that board report isn’t out of date before it’s presented? When forecasts, actuals, and plans are copied across spreadsheets, the finance team can be caught spending time reconciling versions, instead of explaining what the numbers mean.
With Tines, reporting can be built directly on the warehouse and source systems, then refreshed and shared according to each audience’s role.
How it works

Snowflake and source systems are queried directly.



Featured build
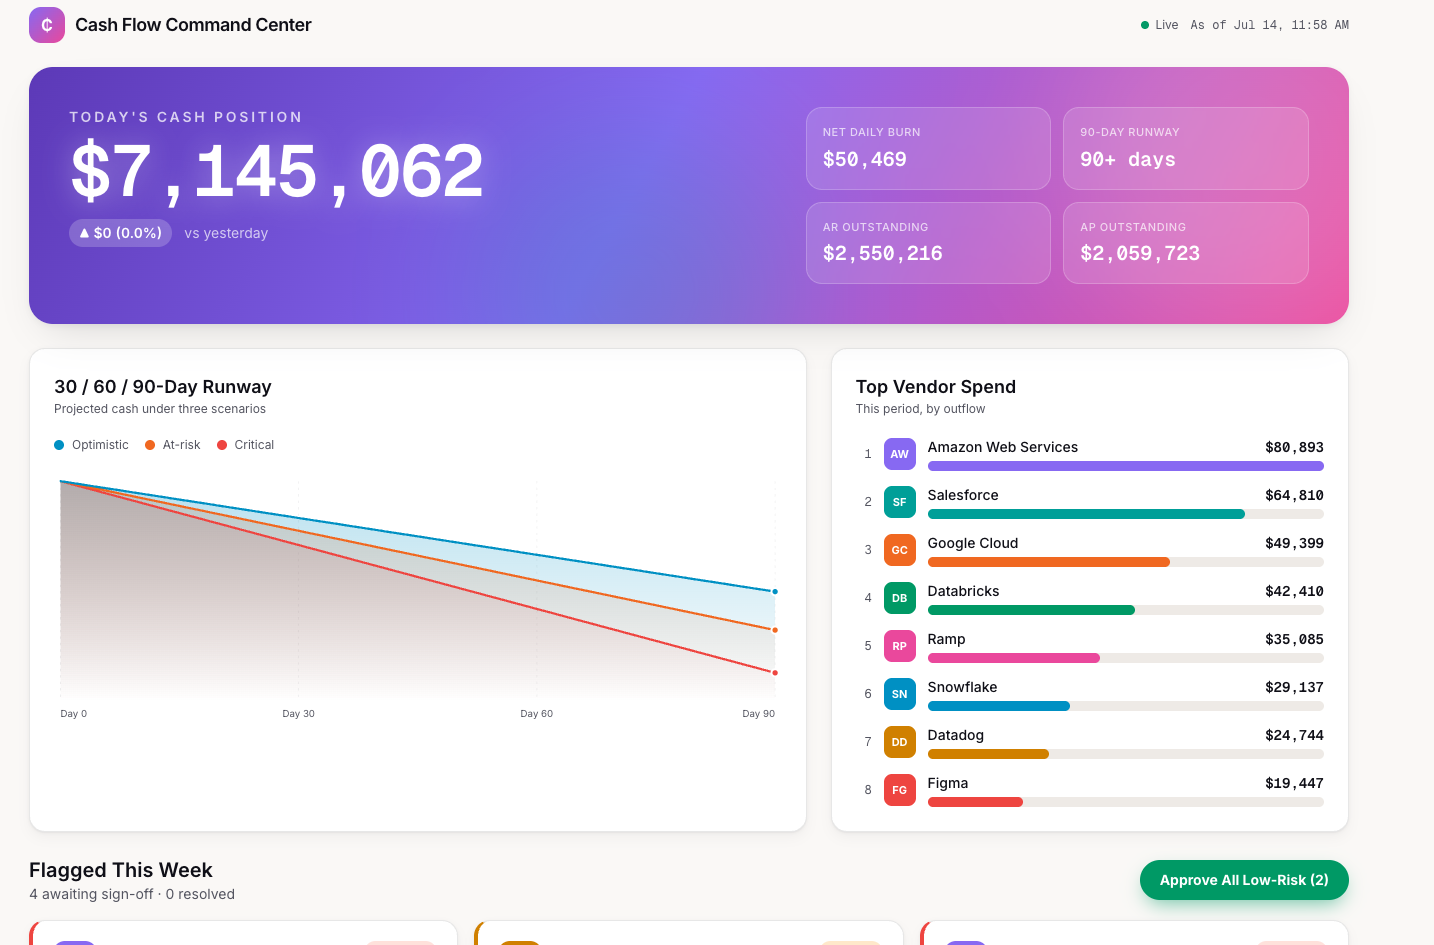
Cash flow command center with automated runway projection and anomaly detection
This workflow automates daily cash flow oversight for CFOs by aggregating transaction, banking, and AP/AR data, calculating 30/60/90-day runway projections, and flagging financial anomalies such as inflated invoices, duplicates, and large transactions. Flagged items are routed to approvers via Slack or email with full context, and all decisions are logged to an audit trail. The workflow includes a vibrant, executive-facing dashboard that displays real-time cash position, runway charts, flagged risks, and vendor spend in a modern fintech-style interface.
Examples
We’ve assembled a gallery of real-world, ready-to-use apps, agents, and automation templates. Start from a template or from a prompt, using natural language and your own expertise.
Live finance dashboards
Revenue, burn and unit economics on warehouse data, refreshed on schedule.
Headcount plan tracker
Open roles, hires and backfills against plan, synced to the HR system.
 HR & FinanceJob requisition approval workflow with Slack routing and ATS integration
Board pack builder
Assembles the monthly numbers and drafts the commentary for review.
Finance requests dashboard
Incoming requests from email and tools, with status and owner.
Forecast versus actual tracker
Variances by line, with the drivers behind them.
Related use cases
 Commissions and compensationAudit representatives’ compensation against every plan, every month, without the Excel marathon.
 Close, reconciliation and rev recMatch, reconcile and post across systems so the close isn’t a week of exports.
 Spend, vendors and contractsKnow what you’re paying for, what renews when, and who approved it.
 Order-to-cash and collectionsFrom closed deal to cash collected, with the chasing done for you.
 Finance requests and budgetsOne front door for finance requests, and budget owners who know where they stand.