Building a security operations center (SOC) isn’t about piling bodies into a war room or chasing the latest buzzword tool. It’s about designing a lean system that sees real threats, answers quickly, and stays out of its own way. Most organizations do not need 24/7 eyes on glass; they need clean telemetry, automation that cuts noise, and guardrails that keep analysts focused on work that matters.
With that foundation, even a small team can cover business-hour operations without burnout. You will still get false positives—nobody escapes them—but the right playbooks and context give analysts an early “this is a rabbit hole” signal so they can pivot instead of spiral. The result is faster triage, higher impact investigations, and measurable risk reduction.
Everything here comes straight from the field: automating mundane checks, building repeatable detection engineering loops, and tying security capabilities to business objectives so leaders see the value. Whether you are tightening an existing SOC or starting at zero, the best practices that follow will help you ship a modern, resilient operation with no bloat and no heroics, just results.
Summary of key best practices for building a security operations center
Data: The bloodline of the SOC
Collecting and parsing high-quality telemetry data is the foundation of accurate detection and response. If your telemetry is missing, incomplete, or poorly parsed, detections will fail, alerts will generate noise, and your SOC will waste time chasing shadows. You cannot respond to what you cannot see. Proper ingestion ensures full visibility, and normalization allows you to apply consistent, actionable detection logic across all sources.
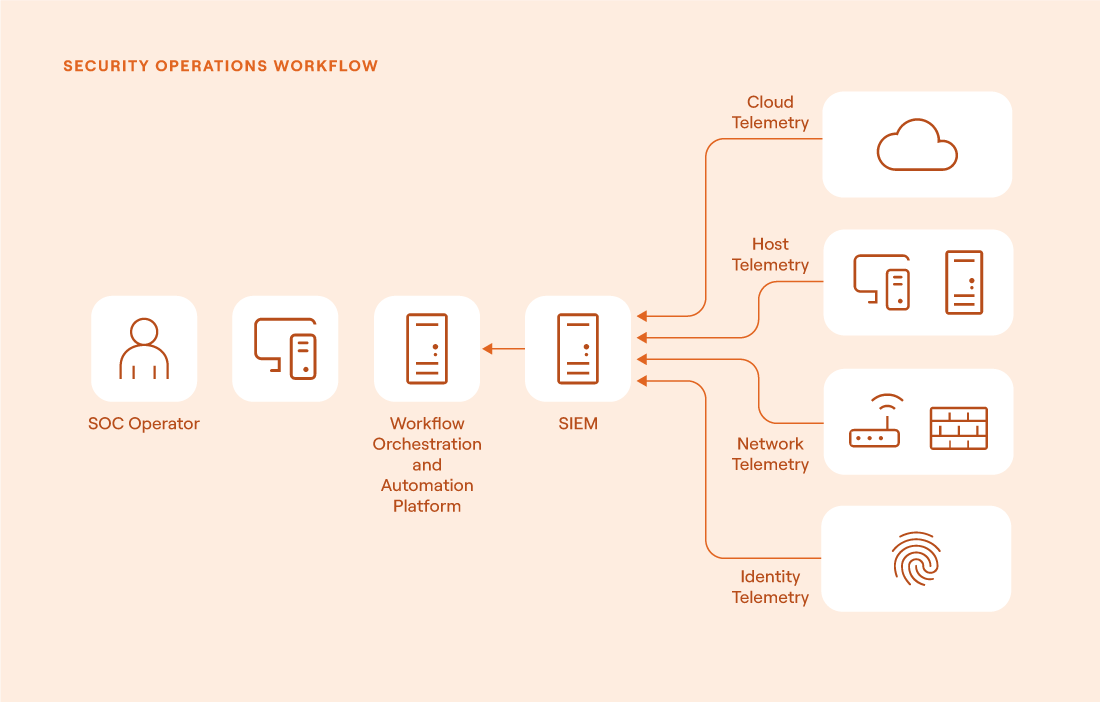
The most critical telemetry spans four key areas, which are often referred to as the “NICE” pillars, as shown in the table below.
Collectively, these data sources cover the critical control planes that attackers target. Endpoint telemetry shows you what’s happening on the ground, cloud telemetry exposes risks in your dynamic environments, network telemetry tracks movement and exfiltration, and identity telemetry reveals how attackers widen access and escalate privileges. For example, if an attacker phishes an employee, the EDR logs will show the initial compromise, the network logs will reveal lateral movement or data staging, CloudTrail logs will capture cloud privilege escalation, and identity logs will surface admin abuse. Miss any one of these, and your SOC only sees part of the picture. Full, properly parsed telemetry is what keeps your team ahead and lets your detections actually work.
Once you have these data sources in place, the next critical step is integrating them into a data analysis platform for centralized aggregation and analysis. The most common tool for this use case is security information and event management (SIEM). A SIEM product serves as the nerve center of your SOC, pulling in telemetry from across systems, normalizing the data, and making it searchable and correlatable in real time. Without this aggregation layer, analysts are forced to jump between disconnected tools, slowing down investigations and increasing the risk of missed signals. A well-integrated SIEM enables you to apply correlation rules, build meaningful detection logic, and trigger automation that ties together activity across the entire environment, giving your SOC a unified, actionable view of threats as they unfold.
But simply aggregating raw data is not enough. To make detections reliable and effective, you need to normalize and structure that data so it can be queried consistently across sources. This is where data normalization becomes a critical pillar of your SOC.
Ingest and parse the right data
Data normalization is the process that turns a bucket of raw logs into a weaponized detection stack. Nothing makes this clearer than looking at theusername filed.
Every intrusion narrative hinges on what ran and with what arguments. Did powershell.exe get passed a one-liner to pull a payload from a remote server? Did net.exe quietly add a new domain admin? The command line is the attacker’s confession. It exposes intent, tooling, and tradecraft all in one line, making it one of the most critical fields your SOC needs to reliably capture and query.
The chaos you inherit
Unfortunately, every OS and security tool records that string differently:
Windows Event ID 4688 logs the full command line only if you enable the “Include command line in process creation events” GPO. Miss that, and you get nothing.
Sysmon Event 1 always grabs it but stores it as CommandLine.
Linux auditd emits an EXECVE record that splits the command into a0, a1, etc., so you have to reassemble it.
EDR vendors get creative: One labels it cmdline, another process.command_line, and a third nests it deep inside process.args.
Timestamps vary. Encodings flip between UTF-8 and UTF-16. Line breaks sneak in from copy-pasted PowerShell scripts. If you run a hunt for -EncodedCommand, half your fleet answers and the other half stays silent because your query never matched the right field, casing, or delimiter.
What it costs you
Without normalization, detection rules fracture by data source. Analysts waste time pulling the real command line from auxiliary logs. Automation scripts break when a vendor’s schema shifts. Worst case, you miss an active beacon because malicious parameters never made it through the parser.
The solution
The exact solution will depend on your SIEM tooling, but the methodology is consistent. First, identify the fields that matter most; this should be a deliberate exercise. Core fields typically include timestamp, username, process start, command line, file name, URL, domain, and IP address. Once you’ve defined your “must-have” field list, validate every data source you onboard. Confirm that its raw fields are being correctly parsed and mapped into your SIEM’s standardized schema. This prevents broken detections and failed investigations before they happen.
The payoff
Once normalized, a single detection rule—like “process.command_line matches /-EncodedCommand/i”—works everywhere. Timelines stitch together cleanly. Analysts pivot across hosts without mental gymnastics. Threat hunts run in seconds, not hours.
Normalization transforms messy, vendor-specific data into dependable, automatable evidence. Get it right, and your SOC moves with precision; get it wrong, and no amount of budget or headcount will patch the blind spots you’re leaving behind.
Endpoint visibility
Arguably, your most important data source is the endpoint. In nearly every cyber incident, the attacker will hit an endpoint at some point in the kill chain, whether to establish a foothold, execute commands, move laterally, or deploy payloads. Ideally, you have an EDR deployed to all endpoints, but even the best EDR can only see what the system exposes. Depending on your EDR and operating system, you can significantly improve detection coverage by hardening local audit settings.
Windows
Process command-line logging: Enable “Include command line in process creation events” and audit process creation success.
PowerShell logging: Enable script block and module logging. For deeper visibility, turn on transcription logging and set a local transcript path.
Security audit policies: Enable auditing for logon events, credential validation, process creation, sensitive privilege use, and account management (success and failure where applicable).
Object access: Audit file shares, removable storage, registry access, and SAM to catch lateral movement and data exfiltration.
macOS
Process execution and command-line telemetry: Use auditd OpenBSM by editing /etc/security/audit_control with flags lo, ad, ex, fc, fw, and reloading with audit -s.
Endpoint security framework: Grant your EDR or osquery the com.apple.developer.endpoint-security.client entitlement and full disk access to capture real-time ES_EVENT_TYPE_NOTIFY_EXEC events.
Shell history with timestamps: Configure /etc/zshrc and /etc/profile to set HISTFILESIZE=100000, HISTCONTROL=ignorespace, and HISTTIMEFORMAT="%Y-%m-%dT%H:%M:%S%z " for full interactive command logging. Ship .zsh_history via osquery’s file monitoring.
Unix
Use auditd or the Linux Audit Framework to watch the execve syscall across architectures.
Configure /etc/profile.d/history.sh (or equivalent) to ensure that shell commands are timestamped and logged.
Set LogLevel VERBOSE in sshd_config to capture non-interactive SSH commands.
Enable sudo input/output logging in /etc/sudoers using visudo.
Ensure that pam_tty_audit.so is active in the system-auth or common-session stack to record privileged keystrokes.
Audit sensitive syscalls like setuid, setgid, and capability changes to track privilege escalations.
Example scenario
To illustrate why this matters, imagine that an attacker disables PowerShell logging on a compromised Windows host. If your EDR configuration doesn’t enforce command-line auditing, and your parser isn’t set up to correctly extract that field, this activity will slip through undetected. Validating endpoint telemetry configurations and continuously testing your log sources is critical to closing these blind spots. Without this discipline, even the best tooling can leave your SOC flying blind at the exact moment you need it most.
Pick the right core tooling
Select tools that provide visibility, response capabilities, and seamless integration without adding unnecessary overhead. The three core components are SIEM, a workflow orchestration and automation platform, and EDR. Think of the workflow orchestration platform as the brain orchestrating decisions, the SIEM as the spine connecting your data and detections, and the EDR as the hands and feet executing actions on the endpoint.
Your SOC’s speed and accuracy depend on how well these tools work together. Disconnected systems increase analyst fatigue, slow down response, and add friction. Choosing user-friendly, API-accessible platforms with low-code support enables both junior and senior analysts to operate effectively. The workflow orchestration and automation platform becomes your central coordination layer, automating everything from triage to containment to stakeholder notification. This turns playbooks into real, repeatable response mechanisms that scale without extra headcount.
A workflow orchestration and automation platform is the central nervous system of a modern SOC. It connects your detection stack, SIEM, EDR, threat intelligence, ticketing systems, and cloud platforms and automates repetitive, manual steps so your team can focus on high-impact work. Using a platform like Tines, you can build automated playbooks that enrich alerts, correlate cross-system data, trigger containment actions, notify stakeholders, and even generate reports, all without constant human intervention.
Beyond automation, it enforces consistency, ensuring that every phishing investigation or privilege escalation incident follows a defined, repeatable path. This reduces variability, improves speed, and enables junior analysts to contribute safely within well-defined guardrails. Low-code or no-code design makes these platforms accessible to the entire team, not just engineers, democratizing automation and making continuous improvement possible.
What to look for in an EDR
When choosing an EDR, look for more than just alerts. Key requirements include:
Full indexing of endpoint events (process, network, file, registry)
High-fidelity telemetry parsing and normalization
Real-time detection of both known and unknown TTPs
Remote shell access, script deployment, file transfer
Process tree visualization with MITRE ATT&CK overlays
Built-in quarantine, rollback, and remediation features
On-demand artifact collection (memory, logs, registry)
Network and DNS context for richer correlations
Tamper resistance and detection
Dynamic host grouping for policy and management
EDR agents should support all major platforms, including Windows, Linux, macOS, and containers. Older enterprise environments may also need legacy system support (like AIX or Solaris).
What to look for in a workflow orchestration and automation platform
Look for these features:
Prebuilt integrations and the ability to build additional integrations via API
Low-code or no-code support for rapid playbook development
Native integration with threat intelligence modules
Strong API capabilities for bi-directional communication with SIEM, EDR, ticketing, and business systems
What to look for in a SIEM
Check for these capabilities:
Out-of-the-box ingestion support for key NICE data sources relevant to your environment
Strong API support to enable automation with orchestration tools
Query assistance, detection tuning features, and content libraries for faster rule development
Leverage orchestration and automation
Manual triage is a time sink. Too often, your best analysts spend hours copying IOCs into VirusTotal or chasing down IP lookups instead of focusing on threat hunting and strategy. A well-built workflow orchestration and automation platform flips that script: Machines handle the repetitive grunt work, and humans focus on thinking. Here’s how to turn “automation” from a buzzword into real operational capacity.
How workflow orchestration and automation levels up your security operations center (source)
Pick the right first use cases
Start where the manual pain is obvious and the automation risk is low.
Knocking out these wins frees up hours of analyst time daily without even touching high-risk systems.
Architect your playbooks
Structure your automation workflows with the same discipline as software development:
Trigger: SIEM alert, EDR webhook, or mailbox listener.
Enrich: Query threat intel, CMDB, Active Directory, GeoIP, asset metadata, and now even LLMs for summarized context.
Decide: For example, “If VirusTotal score > 80 and asset role = "prod server" THEN high severity.”
Act: Create or append ticket, notify channel, isolate host, block IP, capture PCAP.
Record: Log every step into the case timeline for full auditability.
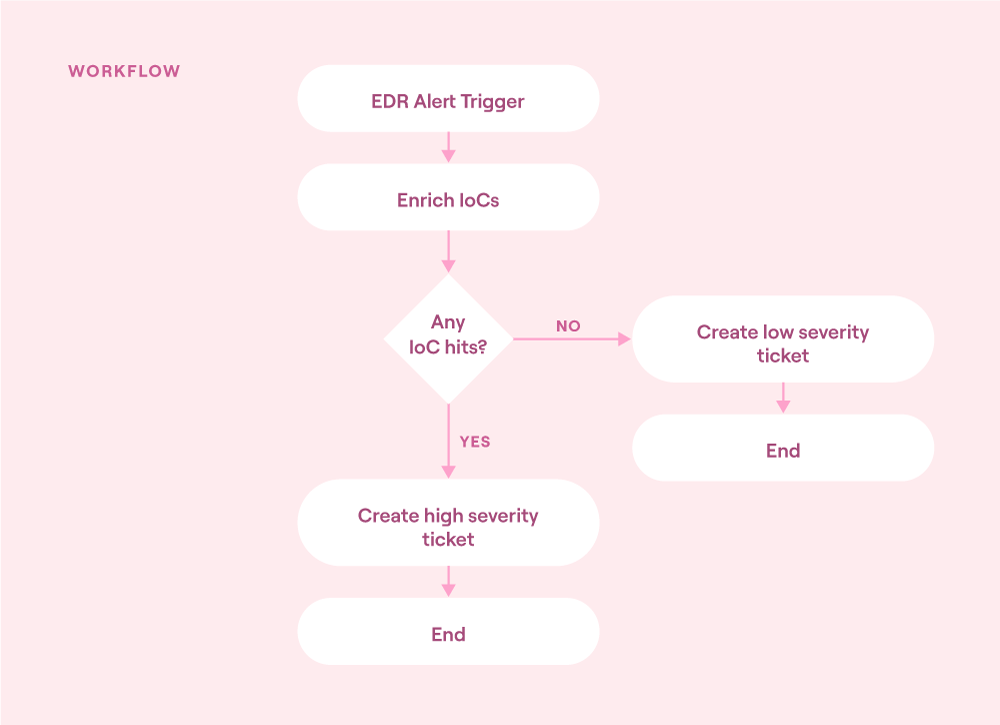
Workflow orchestration and automation flowchart (source)
Empower junior analysts
Low-code orchestration platforms let Tier 1 analysts build and extend workflows without needing Python mastery:
Use prebuilt templates for enrichment, containment, and ticketing steps.
Lock destructive actions (e.g., deleting S3 buckets, disabling user accounts) behind approval gates for senior review.
Expose human-in-the-loop tasks (like “Does this domain belong to Marketing?”) through Slack or Teams buttons; automation waits for the answer before proceeding.
This approach transforms junior analysts from ticket routers into true force multipliers.
Close the feedback loop
Track mean time to respond, false positive rates, and tickets closed per analyst hour before and after automation. Report the gains to leadership; budget approvals follow when you show 5× throughput improvements.
Hold weekly retrospectives, and decide which manual steps this week can be scripted next. Add them to the automation backlog.
Finally, build playbooks to fail fast; send “automation error” alerts if any API or action node fails, so ops can patch tokens or adjust configurations before gaps form.
Roadmap after quick wins
Once initial wins are secured, extend automation to:
Phishing triage: Parse email headers, detonate attachments in a sandbox, and auto-close benign campaigns. Automatically remediate true positives and push IoCs to the email filter.
Credential leak response: Monitor for leaked credentials, force password resets, and disable stale tokens.
Cloud security drift: Detect risky IAM or bucket policy changes, auto-tag for review, or trigger rollbacks.
Every 30-minute manual workflow you automate pays you back forever. Start small, treat playbooks like code, and let your orchestration engine handle the muscle memory so your analysts can focus on what only humans can do: Think like adversaries, refine detections, and drive the security program forward.
This sort of shift doesn’t just improve SOC efficiency; it reduces burnout, lowers turnover, and creates space for your analysts to grow their skills and capabilities. In the long run, this investment strengthens both individual contributors and the entire security program, helping your organization mature, innovate, and stay ahead of evolving threats.
Implement a detection-as-code methodology
Treat detections like software: version-controlled, testable, and continuously improved.
Detection logic is a living asset. Writing detections as code allows teams to apply engineering rigor—including peer review, structured testing, and CI/CD deployment—ensuring consistency and reducing the risk of regressions. As attacker techniques evolve, integrating red team or purple team validation along with automated false positive checks helps maintain a high signal-to-noise ratio, keeping detections sharp and relevant.
The maturity here can vary significantly across organizations, depending on tooling, team size, and capabilities.
Engineering-driven detection as code
In mature SOCs with dedicated detection engineers, the team follows a true detection-as-code methodology. Detection engineers write rules using a standardized language like Sigma and push them into a Git repository for version control. This triggers a CI/CD pipeline that enforces several automated steps:
Format and documentation validation: The pipeline checks the Sigma rule’s formatting, ensuring correct syntax, required fields, and proper documentation.
Translation: Using pySigma or a custom solution, the Sigma rules are then translated to the SIEM's native query language.
Historical false positive check: An automated API call runs the new rule against historical SIEM data, identifying whether it produces excessive noise or redundant matches.
Adversary emulation test: Another API call triggers an automated test using Atomic Red Team or a similar framework, validating that the detection correctly fires when the relevant TTPs are simulated.
Automated deployment: Once these tests pass, the rule is automatically pushed to the SIEM via API, making the new detection live without manual handoff.
A full pipeline like this ensures that every detection is high-quality, actionable, and measured, minimizing alert fatigue while maximizing coverage. For example, a new Sigma rule is written to detect suspicious Entra ID privilege escalation. The rule is committed to Git, peer-reviewed, and passed through a CI pipeline that tests it against both benign and malicious datasets. False positives are identified and tuned before being pushed to production, and once validated, the rule is automatically deployed to the SIEM via API. Here is an example of a Sigma rule from the public GitHub repository:
title: Local Firewall Rules Enumeration Via NetFirewallRule Cmdlet
id: ea207a23-b441-4a17-9f76-ad5be47d51d3
status: test
description: Detects execution of "Get-NetFirewallRule" or "Show-NetFirewallRule" to enumerate the local firewall rules on a host.
references:
    - https://learn.microsoft.com/en-us/powershell/module/netsecurity/get-netfirewallrule?view=windowsserver2022-ps
    - https://learn.microsoft.com/en-us/powershell/module/netsecurity/show-netfirewallrule?view=windowsserver2022-ps
author: Christopher Peacock @SecurePeacock, SCYTHE @scythe_io
date: 2023-07-13
tags:
    - detection.threat-hunting
    - attack.discovery
    - attack.t1518.001
    - attack.t1016
logsource:
    product: windows
    category: ps_module
    definition: 0ad03ef1-f21b-4a79-8ce8-e6900c54b65b
detection:
    selection_payload:
        Payload|contains:
            - 'Get-NetFirewallRule'
            - 'Show-NetFirewallRule'
    selection_contextinfo:
        ContextInfo|contains:
            - 'Get-NetFirewallRule'
            - 'Show-NetFirewallRule'
    condition: 1 of selection_*
falsepositives:
    - Administration scripts
level: low
Lightweight detection-as-code practices
Not every organization needs (or has) this level of engineering. A leaner SOC can still apply detection-as-code principles by focusing on manual processes based on the same concepts.
Before pushing a new rule, analysts should:
Run test queries against historical data to check for false positives and confirm the rule’s precision.
Simulate or replay known attack data to verify the rule’s effectiveness.
Document the detection logic, including what changes were made, what threat it covers, and how to respond when it fires.
Submit this documentation to a shared repository or knowledge base to keep the team aligned.
Even without automated pipelines, these steps bring discipline and traceability to detection development, reducing rushed or poorly tested deployments.
This process is not just about automation; it’s about ensuring that only high-confidence, high-value detections make it into your live environment. By applying detection-as-code principles, your SOC reduces noise, improves detection quality, and maintains a resilient, continuously evolving detection stack that keeps pace with the threats your business faces.
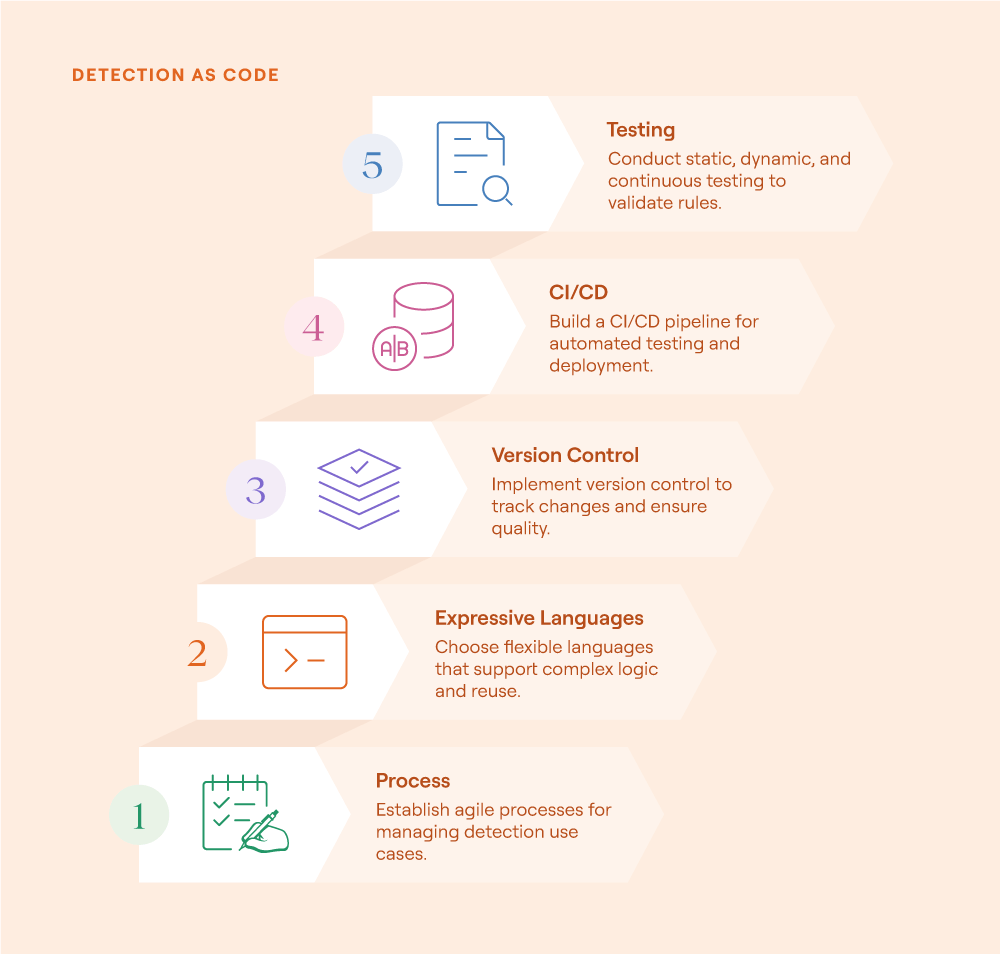
Implementing detection as code (source)
Plug into IT and the business
The ultimate maturity level for a SOC is when it operates so efficiently that it can provide direct services to the business—services only the SOC can deliver because of its expertise, unique visibility, and specialized tooling. At this stage, the SOC is not just a reactive function handling alerts and incidents. It becomes a proactive partner to other departments, helping solve problems, reduce risk, and strengthen the organization as a whole.
For example, IT is troubleshooting an application outage but has no clear idea where to look. The SOC steps in, applying advanced forensic techniques to identify the root cause. They trace the failure to an observability agent causing memory issues, which leads to an application crash in production. This is the kind of insight that only the SOC can provide because they have endpoint telemetry, forensic tools, and the expertise to dig deeper than traditional IT support.
In another case, HR or the legal team is conducting an internal investigation. They turn to the SOC to collect forensic artifacts, such as sign-in logs, web history, or eDiscovery, to support the investigation securely and accurately. The SOC ensures that evidence is collected in a forensically sound manner that can stand up to scrutiny if needed.
Or consider when the cloud or product engineering team is designing a new application architecture and needs a security perspective. They engage the SOC to perform a threat modeling exercise, mapping out the risks associated with the design and helping to build a mitigation and hardening plan. Here, the SOC is actively shaping how the business builds resilient systems.
At this maturity level, the SOC moves from being a cost center to being a value-adding partner, delivering specialized consulting, forensic expertise, and risk reduction services that directly support business outcomes. This is where true operational excellence transforms into strategic impact.
Last thoughts
A modern SOC doesn’t need a 24/7 team to be effective; it needs the right design. By focusing on high-quality telemetry, integrated tooling, automation, and detection-as-code, small teams can consistently detect and respond to real threats during normal working hours. The goal is operational efficiency without compromising coverage.
These best practices are grounded in real-world experience and are built for lean teams who want to do more with less, while avoiding burnout and delivering measurable value across the organization. When the SOC is integrated with IT and business functions, it becomes more than just an incident response unit. It becomes a strategic asset.