


Splunk is a powerful data ingestion, manipulation, and analytics platform that has grown over the years to form a whole suite of products. Here, we look specifically at Splunk Enterprise, the original and still much-loved core. We will explore and then automate search operations for a simple threat-hunting example. We will then turn our learnings into a fully-fledged self-service internal tool for use by colleagues (or perhaps other teams in your organization).
Splunk Automation and APIs
There are many reasons to automate Splunk's operations. It is a rich and versatile platform that, once fed with multiple data sources, can help you surface and identify valuable insights and trigger actions. Splunk even has its own Search Processing Language (SPL) and multiple training and certification tracks. Its APIs are rich, mature, and first-class! The Splunk Cloud trial has some API limitations and restrictions, so we’ll use Splunk Enterprise running on an Amazon AWS AMI instance. We recommend you do, too, if you want to explore the API functionality quickly and conveniently, though all commercial or enterprise versions should have the API enabled.
Before we dive into the API, some basic nomenclature and concepts should be understood around Splunk, mainly that of forwarders and receivers. Splunk can get very complicated very quickly if you do larger deployments or run clusters, so we’re just running a single forwarder (Windows host + event logs) and a single receiver (our Splunk Enterprise host). Now, let’s talk APIs!
When diving into an API, the first concerns tend to be:
Where and what sort of documentation does the API have?
What specific endpoint(s) can I access?
How do I authenticate?
Are there any limitations (including rate-limits), or ‘gotchas’ ?
What tooling can I use to quickly prototype and test?
Splunk API Documentation (or related)
Main Splunk documentation hub here (Splunk Enterprise manual here).
Splunkbase (application marketplace) here.
Splunk API Endpoints
Depending on your type of install, be it Splunk Cloud or Splunk Enterprise, your host (FQDN) will be different. However, specific types of endpoints are grouped into resource groups, of which “search” is one. The REST API is exposed on TCP port 8089 and responds with XML unless you ask for another output mode in the query or action.
Splunk API Authentication
Basic HTTP authentication (RFC 2617), session-based, and token authentication (Splunk v7.3+) types are available. In this guide, we will be defaulting to simple Basic HTTP authentication.
Splunk API Limitations
Splunk Cloud is extremely limited in terms of endpoint availability. It only exposes the “Search” endpoint, that is, if you can get it enabled on your instance by manually calling support! We recommend not being put off by the term “enterprise” in Splunk Enterprise and proceeding with the AWS AMI (or doing a full install yourself on your host). This will save you time and enable you to explore the API faster. Additional Splunk restrictions and limitations with the API are listed here.
Tooling
cURL on the CLI is the fastest way to get going, albeit you could just as easily use Postman, PowerShell, or another scripting tool (or language) of your choice. Later we will also look at using Tines for a more holistic workflow automation approach.
Quick Setup Up
As mentioned briefly earlier, we are using an AWS Splunk AMI on the AWS free tier to get us going with a clean and fully functional Splunk install. We’re also running a Windows 2012 R2 Datacenter instance in GCP (Google Cloud Platform) as our forwarder, which will send Splunk its Windows Event log data.
Forwarder (Windows 2012 R2 )
The Windows host requires an install of the Splunk Universal Forwarder. Only the receiving Splunk Enterprise server hostname (or IP) and port TCP 9997 need to be configured during the install (for which you are prompted). You do not need to configure the deployment server option. Ensure the Windows firewall permits this port outbound to your receiver.
Receiver (Splunk Enterprise AWS AMI)
We give our AWS instance an Elastic IP, so it has a static IP throughout our usage. Also, rather than add the hostname to DNS, you could just edit your hosts file for testing purposes, or of course use the IP in the URL directly. After accessing the Splunk web interface via HTTP (not HTTPS, as it comes with an untrusted self-signed certificate) on TCP port 8000, we then go to “Apps/Find More Apps” and “Browse More Apps.” Use the keyword “Windows” in the search box and then “Splunk” for the support type tickbox to find and install the “Splunk Add-on For Microsoft Windows”. After a brief service restart, Splunk will now understand the Windows event and logging formats and will also use new data inputs.
Don’t forget to check your Splunk host is listening on TCP 9997 as a receiver. You can check this in “Settings/DATA/Forwarding and Receiving” under “Receive Data/Configure receiving,” which should have TCP 9997 set to “Status” enabled. You can also SSH to the host using the ec2-user and check that a netstat -nlt shows the port in a listening state. The use of an AMI means the configured SecurityGroups should permit all the required traffic.
Note: All our API Actions will be via HTTPS, but we will tell our Action to ignore SSL warnings due to the self-signed certificate. For any commercial or production use, you would indeed generate and install a valid certificate and follow the best current practice for securing and hardening your instance.
Starting Simple with cURL
By using cURL on the command line with the -d switch (to add parameters to the call), we automatically issue a POST request. The -s means silent, as we don’t want any superfluous output. The -k means to ignore the certificate validation (as Splunk is using a self-signed certificate).
Let’s start a search job with a request for any events across all hosts. The ‘|’ pipe to jq (an additional handy multipurpose tool for JSON) gives us color and pretty printed output too.
We then get the below response which contains our job search ID.
{
  "sid": "1602150605.166"
}
Let’s see if the job “1602150605.166” has surfaced any events or results by asking the job endpoint directly.
curl -s -k -u splunk_username:splunk_password \
-d output_mode=json \
“https://tines-splunk:8089/services/search/jobs/1602150605.166” \
| jq
Indeed it has. The eventCount below is 381. There is a lot more information in the Splunk response, but for now, we know it’s working.
{
  ...
  },
  "entry": [
    {
      ...
      },
      "published": "2020-10-08T09:50:05.000+00:00",
      "author": "admin",
      "content": {
        ...
        "dispatchState": "DONE",
        ...
        "eventCount": 381,
        ...
        "resultCount": 381,
     ...
      },
      ...
}Rather than pull back all the event logs, let’s get more specific with our request and then look into the results. With the below POST operation, we also need to ensure we’ve set some search terms; such as the host to search (previously, we used host=* ), the EventCode we’re interested in, and the earliest time (or how far back to search relative to the current time on the Splunk host). The Splunk SPL (Search Processing Language) has a rich syntax we can use.
curl -s -k -u splunk_username:splunk_password \
-d search='search host="geuw2c-tfire01" \
source=WinEventLog:Security \
EventCode=4738 \
earliest=-120m' \
-d output_mode=json \
“https://tines-splunk:8089/services/search/jobs” \
| jqThe specific Windows EventCode we’re looking for is 4738, which indicates “A user account was changed.” It’s most likely not a good thing if lots of unidentified new accounts are popping up on servers or guest accounts are being enabled across a fleet! As per previous, we receive our search job ID.
{
  "sid": "1602063265.20"
}We do not get the results immediately as we’ve kicked off a background job. We don’t know how long the search will take, so we need to subsequently poll that SID endpoint for its state. Let’s ask about the job state:
curl -s -k -u splunk_username:splunk_password \
“https://tines-splunk:8089/services/search/jobs/1602063265.20?output_mode=json”What we’re looking for is the state (more specifically, the “dispatchstate”) of “DONE” but as per the API reference, there can be many states to check for, such as:
QUEUED
PARSING
RUNNING
PAUSED
FINALIZING
FAILED
DONE
The response has many useful fields, such as information about the Splunk host and what endpoints to get further information from, but we're really only interested in what the eventCount or resultCount are (have a go yourself to see what the whole response entails!).
Note: "Events" are considered non-transformed raw data as supplied by the original forwarders, whereas "Results" are considered processed (or manipulated) events and have a maximum limit per API call.
{
  "links": {},
  "origin": "https://tines-splunk:8089/services/search/jobs",
  "updated": "2020-10-07T08:54:20+00:00",
  "generator": {
    "build": "152fb4b2bb96",
    "version": "8.0.6"
  },
  "entry": [
    ...
      "published": "2020-10-07T08:46:18.000+00:00",
      "author": "admin",
      "content": {
        ...
        "dispatchState": "DONE",
        ...
        "eventCount": 1,
        ...
        "eventSearch": "search (EventCode=4738 earliest=-120m host=\"geuw2c-tfire01\" source=WinEventLog:Security)",
        ...
        "resultCount": 1,
        ...
}Our search is DONE, yet if it was longer running or failed, we would require some programming logic to poll the endpoint and respond to differing states. For now, let’s take a quick look at the results, or should I say events?
Tip: Before looking at the “results,” and because we are on the CLI, let’s tell Splunk to save this job so we have more time to play around with it (rather than have it quickly expire and have to start again from scratch). To do this, we will issue a request to the control endpoint of the specific job. If we were programmatically accessing this, we would not necessarily require this, but because we are issuing manual commands and taking our time to explore, it would be wise to save the job as it will avoid future annoyances. So, let’s issue the Action to ‘save’ it:
curl -s -k -u splunk_username:splunk_password \
-d action=save \
-d output_mode=json \
"https://tines-splunk:8089/services/search/jobs/1602063265.20/control" \
| jq
Splunk will now give this job more time to live (604800 seconds is seven days):
{
  "messages": [
    {
      "type": "INFO",
      "text": "The ttl of the search job was changed to 604800."
    }
  ]
}OK, so far, so good, let's issue a GET to the /services/search/jobs/<sid>/events</sid> endpoint where we should get our “results,” for which we know there is definitely at least one!
curl -s -k -u splunk_username:splunk_password \
“https://tines-splunk:8089/services/search/jobs/1602063265.20/events?output_mode=json” \
| jqBelow we have found an instance of a changed user account, specifically a Guest account.
      "Message": "A user account was changed.\r\n\r\nSubject:\r\n\tSecurity ID:\t\tS-1-5-21-1645331581-2600012711-1800141775-1001\r\n\tAccount Name:\t\tdonal\r\n\tAccount Domain:\t\tGEUW2C-TFIRE01\r\n\tLogon ID:\t\t0x1565E9\r\n\r\nTarget Account:\r\n\tSecurity ID:\t\tS-1-5-21-1645331581-2600012711-1800141775-501\r\n\tAccount Name:\t\tGuest\r\n\tAccount Domain:\t\tGEUW2C-TFIRE01\r\n\r\nChanged Attributes:\r\n\tSAM Account Name:\tGuest\r\n\tDisplay Name:\t\t\r\n\tUser Principal Name:\t-\r\n\tHome Directory:\t\t\r\n\tHome Drive:\t\t\r\n\tScript Path:\t\t\r\n\tProfile Path:\t\t\r\n\tUser Workstations:\t\r\n\tPassword Last Set:\t10/6/2020 10:28:47 AM\r\n\tAccount Expires:\t\t\r\n\tPrimary Group ID:\t513\r\n\tAllowedToDelegateTo:\t-\r\n\tOld UAC Value:\t\t0x215\r\n\tNew UAC Value:\t\t0x214\r\n\tUser Account Control:\t\r\n\t\tAccount Enabled\r\n\tUser Parameters:\t\r\n\tSID History:\t\t-\r\n\tLogon Hours:\t\tAll\r\n\r\nAdditional Information:\r\n\tPrivileges:\t\t-",
      "_bkt": "main~3~2D3F2481-387E-482E-9041-083F3C6C04F5",
      "_cd": "3:4880",
      "_indextime": "1602060351",
      "_pre_msg": "10/07/2020 08:45:50 AM\nLogName=Security\nSourceName=Microsoft Windows security auditing.\nEventCode=4738\nEventType=0\nType=Information\nComputerName=geuw2c-tfire01\nTaskCategory=User Account Management\nOpCode=Info\nRecordNumber=2753\nKeywords=Audit Success",
      "_raw": "10/07/2020 08:45:50 AM\nLogName=Security\nSourceName=Microsoft Windows security auditing.\nEventCode=4738\nEventType=0\nType=Information\nComputerName=geuw2c-tfire01\nTaskCategory=User Account Management\nOpCode=Info\nRecordNumber=2753\nKeywords=Audit Success\nMessage=A user account was changed.\r\n\r\nSubject:\r\n\tSecurity ID:\t\tS-1-5-21-1645331581-2600012711-1800141775-1001\r\n\tAccount Name:\t\tdonal\r\n\tAccount Domain:\t\tGEUW2C-TFIRE01\r\n\tLogon ID:\t\t0x1565E9\r\n\r\nTarget Account:\r\n\tSecurity ID:\t\tS-1-5-21-1645331581-2600012711-1800141775-501\r\n\tAccount Name:\t\tGuest\r\n\tAccount Domain:\t\tGEUW2C-TFIRE01\r\n\r\nChanged Attributes:\r\n\tSAM Account Name:\tGuest\r\n\tDisplay Name:\t\t\r\n\tUser Principal Name:\t-\r\n\tHome Directory:\t\t\r\n\tHome Drive:\t\t\r\n\tScript Path:\t\t\r\n\tProfile Path:\t\t\r\n\tUser Workstations:\t\r\n\tPassword Last Set:\t10/6/2020 10:28:47 AM\r\n\tAccount Expires:\t\t\r\n\tPrimary Group ID:\t513\r\n\tAllowedToDelegateTo:\t-\r\n\tOld UAC Value:\t\t0x215\r\n\tNew UAC Value:\t\t0x214\r\n\tUser Account Control:\t\r\n\t\tAccount Enabled\r\n\tUser Parameters:\t\r\n\tSID History:\t\t-\r\n\tLogon Hours:\t\tAll\r\n\r\nAdditional Information:\r\n\tPrivileges:\t\t-",
      "_serial": "0",
      ...
}For clarity, the Message portion formatted cleanly reads:
A user account was changed.

Subject:
	Security ID:		S-1-5-21-1645331581-2600012711-1800141775-1001
	Account Name:	donal
	Account Domain:	GEUW2C-TFIRE01
	Logon ID:		0x1565E9

Target Account:
	Security ID:		S-1-5-21-1645331581-2600012711-1800141775-501
	Account Name:	Guest
	Account Domain:	GEUW2C-TFIRE01

Changed Attributes:
	SAM Account Name:	Guest
	Display Name:
	User Principal Name:	-
	Home Directory:
	Home Drive:
	Script Path:
	Profile Path:
	User Workstations:
	Password Last Set:	10/6/2020 10:28:47 AM
	Account Expires:
	Primary Group ID:	513
	AllowedToDelegateTo:-
	Old UAC Value:	0x215
	New UAC Value:	0x214
	User Account Control:Account Enabled
	User Parameters:
	SID History:		-
	Logon Hours:		All

Additional Information:
	Privileges:		-
But what if we could automate these steps (and include polling and error-checking logic)? Perhaps we could add some more useful Windows Event Codes to check for evidence of miscreants and broader foul play? Maybe we could provide a simple form to produce a canned report that would also email back to the requester with a CSV file containing the results?
Well, let’s try it with a simple visual workflow builder...
Further and Faster with Tines
Here we start with a visual Storyboard by dragging and dropping templated Actions into our workflow Story. We can quickly emulate our previous steps in Tines. We will, however, go further by making them more robust, modular, and useful with a few additional tweaks.

Tines simple steps to interact with Splunk.
Our initial Story flow works, but unfortunately, we were so fast (with each successive step) that the Splunk job status came back with a job dispatchState of “PARSING”. This means our job was incomplete, and our subsequent search results call returned empty.
More Resilience
Let’s wrap some simple defensive logic around our HTTP Request Actions and also add in some error checking (and polling), modularity, and even an email capability.
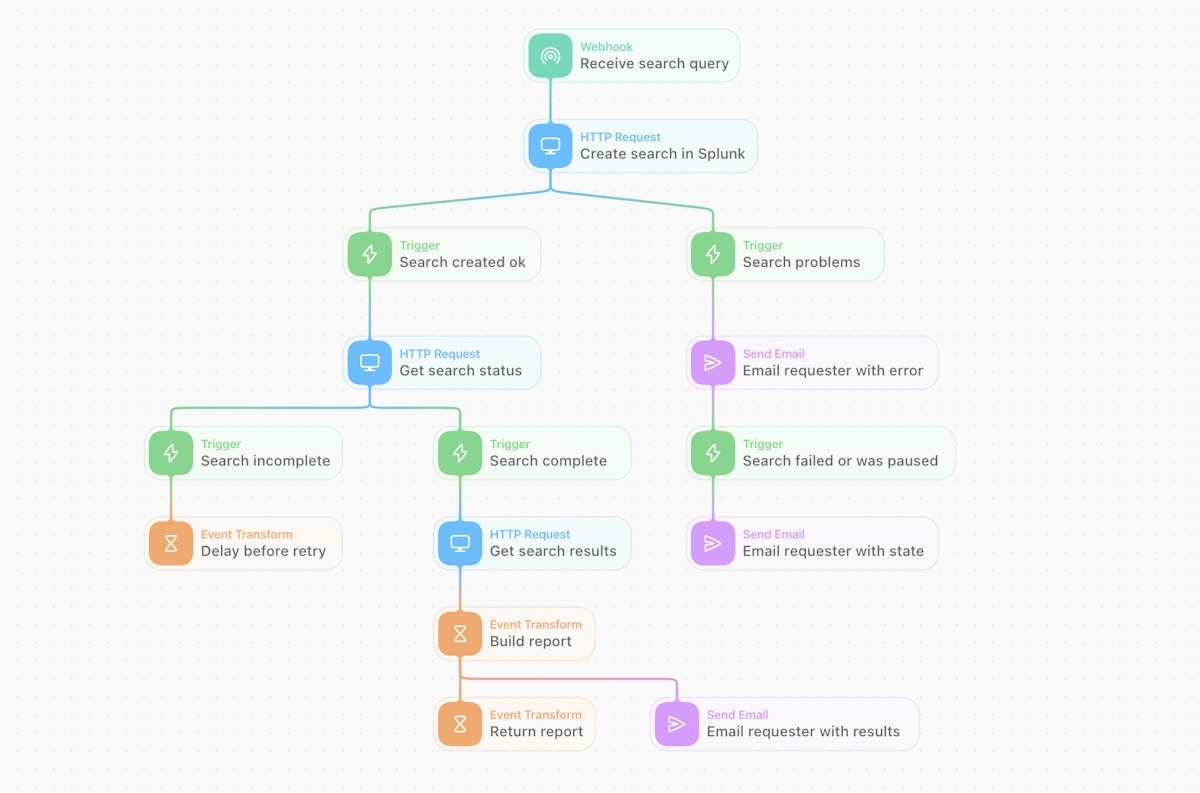
A more resilient and functional Tines workflow to automate the threat hunting process (or perhaps execute a predefined helpdesk query!)
A more resilient and functional Tines workflow to automate the threat-hunting process (or perhaps execute a predefined helpdesk query!)
We construct a simple Story that also includes a ‘polling’ retry loop (for the search status), one that also handles any errors or problem conditions that are encountered. This logic can grow and evolve over time. It can also take advantage of a huge range of vendor or other platform endpoints to increase the automation’s value, i.e., not just Splunk functionality but a whole range of templated integrations (or you can make your own)!
Emailing Results
Once our job completes, our workflow will send an email with an attached text file containing our CSV-based results. This CSV file is not from the output_mode of type CSV in Splunk, but one we’ve reconstructed with the specific and pertinent information we need (or want to share) from the Splunk search.
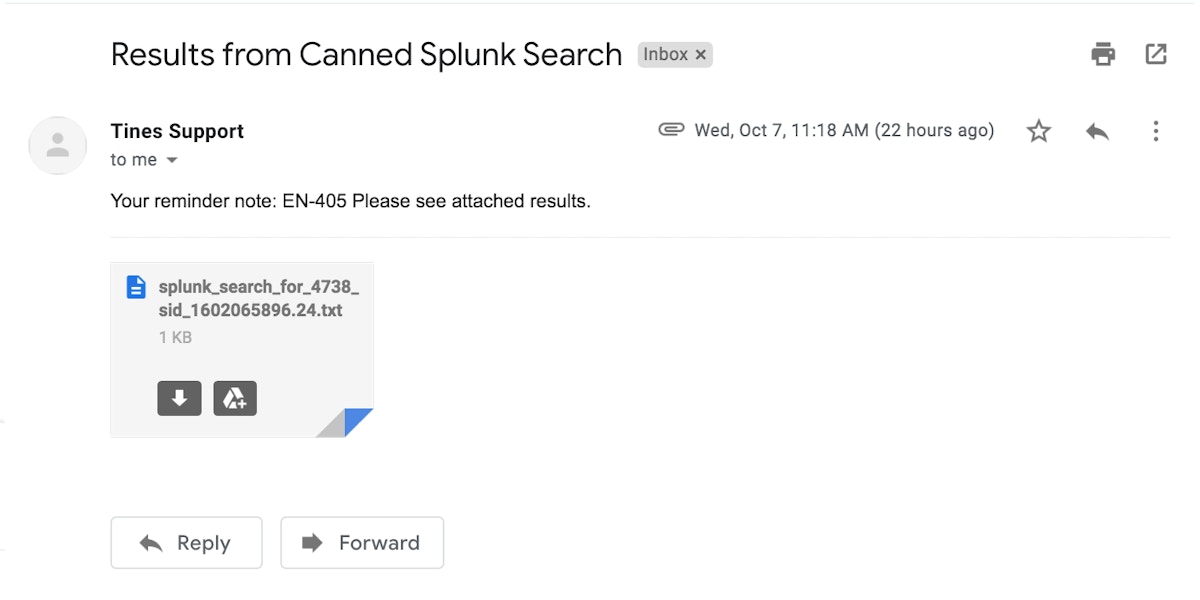
Automatic email with attached CSV results to requester.
Modularity and Reusability
With the addition of the Webhook Action at the start and an Event Transform Action at the bottom, we can now also use our Story in a more modular fashion. We can fully abstract it behind a single “Send To Story” Action that can be used in other stories.

Making the story modular and simply re-usable.
Behind the Curtain
If we were to look under the hood at any Action, but more specifically the “Create Search in Splunk” Action, it looks very close to our cURL example but is all JSON. It takes its search parameters from the initial Webhook Action. The HTTP Request Action also has additional error checking for non-positively associated HTTP error codes “[0,400-499,500-599]” and will also alert us of such.
//{{RESOURCE.splunk}}/services/search/jobs",
  "content_type": "form",
  "method": "post",
  "payload": {
    "search": "search host=* source=WinEventLog:Security EventCode={{ .receive_search_query.body.event_code.first | split: \":\" | first }} earliest=-{{ .receive_search_query.body.hours }}h",
    "output_mode": "json",
    "count": "{{ .receive_search_query.body.max_count.first | split: \":\" | first  }}"
  },
  "basic_auth": [
    [ "{{RESOURCE. splunk_username }}",
    "{{CREDENTIAL splunk_password }}" ],
  "disable_ssl_verification": "true",
  "log_error_on_status": [
Usability
And now, for the pièce de résistance, let’s construct a simple front-end form to top off our workflow so others can simply use it too. This means we can easily provide canned queries that result in automation for any designated team’s use. This is rapid internal tooling made easy. We use an easy WYSIWYG (What You See is What You Get) process in Tines to construct the form, which auto-sends to the Webhook Action.
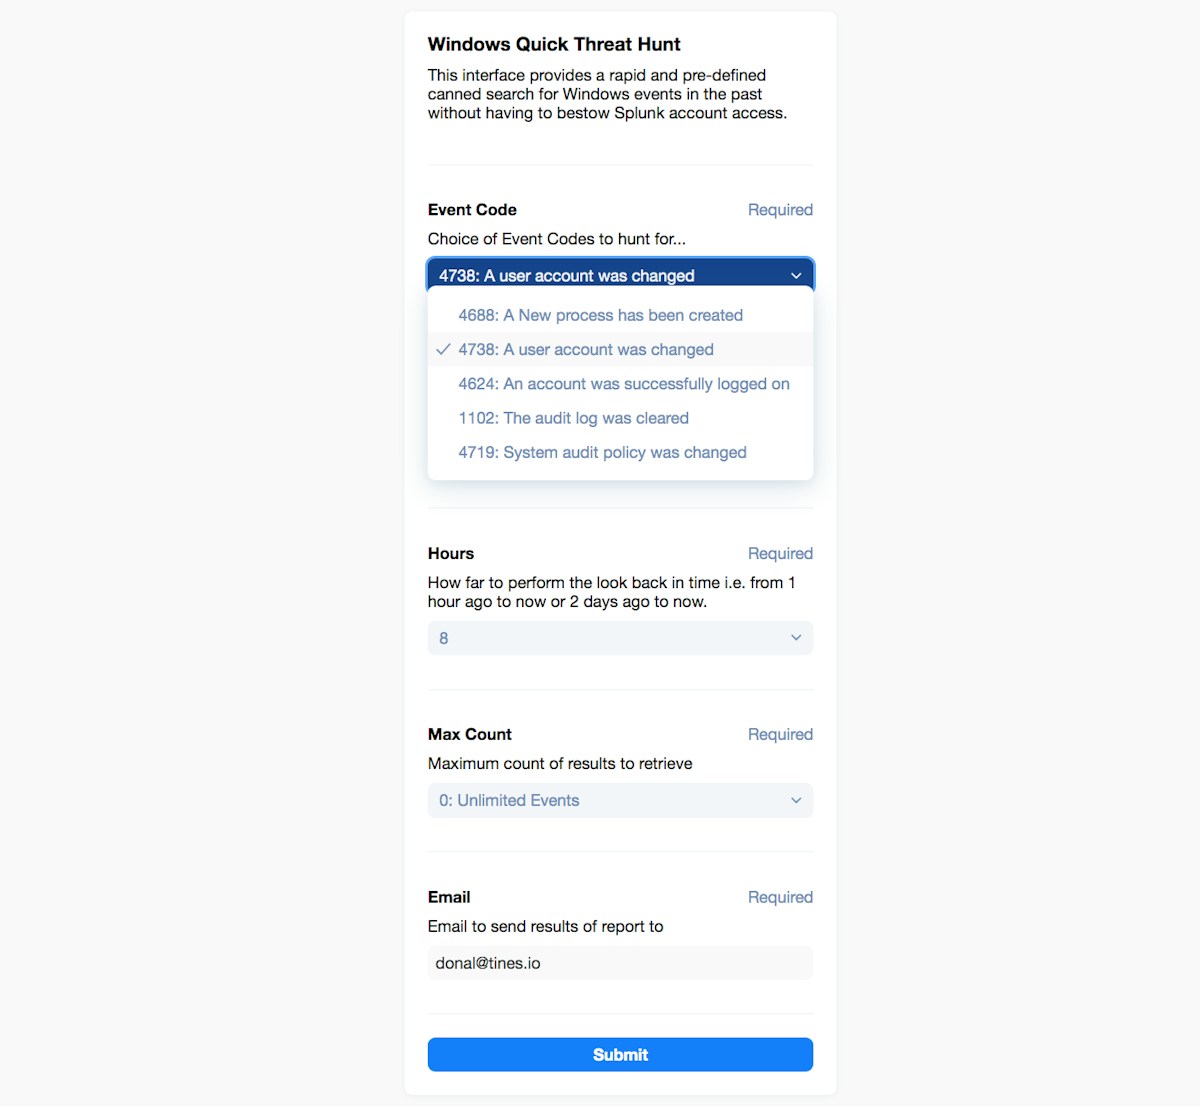
Simple Tines page for common Windows Event Log IoCs (Indicators of Compromise)
Here we are borrowing some very useful Event Codes from the excellent Splunk Blog, namely an entry called “Peeping through Windows (Logs)”. The form above, once clicked, sends the data to our Webhook Action below on the visual Storyboard (the top and first Action called “Receive Search Query”).
Wrap Up
The ‘self-serve’ form, as an entry point to a workflow, means that different groups can now take advantage of automation that you might care to build and share. You could offer ‘self-serve’ to the non-SMEs in your team, adjacent teams, departments, or even some other functionality that could be rapidly offered to customers.
You can now leverage automation without software development expertise and choose who to expose it to and what specific utility you want to share. By empowering those around you, everyone gets to go further, faster.
Note: Visit the Tines Story Library to find the above automation Story here and try it out (or modify it to your needs) using a free Community Edition tenant here.