This exercise offers an introductory experience in creating your first dashboard with records data in Tines. You'll create a dashboard from scratch, add a chart widget that visualizes data from a record type, and configure filters to focus on specific data.
✋ Try this: Create a new records dashboard
🪄Tip
Share dashboards with your team
Once you've created a dashboard, you can share it with team members. Sharing dashboards helps:
Align teams: Rally around common metrics and goals.
Improve transparency: Give stakeholders real-time visibility into workflow data.
Enable self-service: Let team members answer their own questions without requesting reports.
Dashboards can be shared with specific users or teams, and you can control who has view or edit access. This ensures the right people see the right data while maintaining security and control over your records information.
Add a chart to your records table
You can also add a chart directly to your table view using the Add chart button in the top right of the records table. The chart appears above your records, so you can see a visual summary and the underlying data in the same place, without leaving the records page.
This is a good option when you want a quick visual overview of a single record type. If you need to combine data from multiple record types or share a broader view with your team, a dashboard is the better fit.
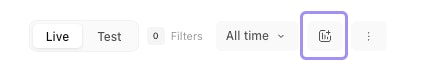
The records table options with the Add chart button highlighted.