
Introduction
In part two of our deep-dive series into end-to-end automation of abuse inbox management and phishing response, we added additional URL threat intelligence services and submitted suspicious attachments to multiple malware sandboxes. We collected the results of URL and eMail analysis and sent the user a prompt-enabled email.
In part three, we’ll expand our automation Story by:
Consuming and actioning prompt widget responses
Securing compromised user accounts
Identifying additional victims in our environment by searching web proxy logs in SIEM
Fetching important context with DHCP log searches
Identifying assets assigned to compromised users
Automating user activity confirmation
When a user clicks the prompt URL, Tines emits an event similar to the below. This event contains details of the prompt response and the event that originally triggered the prompt.
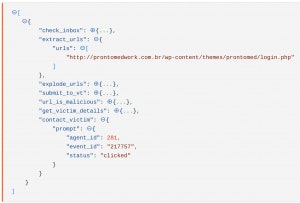
Tines prompt event
Prompt event
We’ll use a trigger Action to detect this case. We’ll name the Action “User confirmed interaction with malicious email”, the options block will look like the below:
{
  "rules": [
    {
      "type": "regex",
      "value": "clicked",
      "path": "{{.contact_victim.prompt.status}}"
    }
  ]
}
Here we’re configuring the trigger Action to emit an event when the prompt status is “clicked”, the value we set in the prompt widget in part 2 of the tutorial.
If this Action emits an event, it indicates that the victim interacted with the malicious email. As such, we’ll need to take remediating action. We could quarantine the user’s machine with an EDR tool or submit a reimage ticket with our helpdesk team. For now, logging out the user and locking the account will suffice.
Automating account takeover response
As the user interacted with the malicious email, we need to remediate a potential account takeover. We’re using OneLogin for Identity and Access Management, so to expedite response we’ll use two HTTP request Actions to first log the user out, and then lock their account.
Included below, is the options block for the logout Action. Unsurprisingly, this is similar in form to the “Get victim details” Action. We take the ID of the user we want to log out from the incoming event, sample shown below:
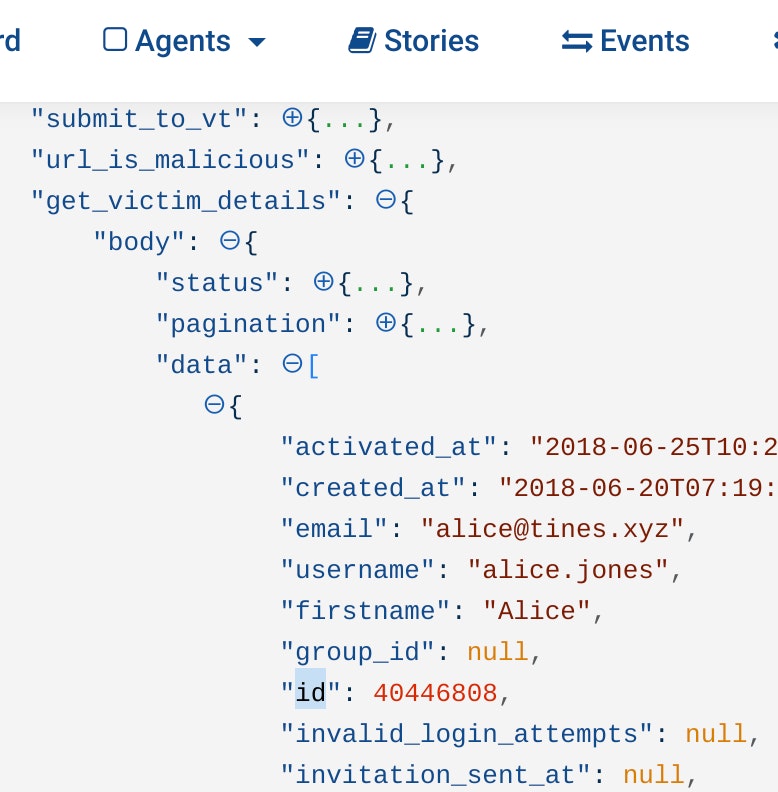
Tines OneLogin Get User API Event
OneLogin Get User API Event
{
  "url": "https://api.us.onelogin.com/api/1/users/{{.get_victim_details.body.data[0].id}}/logout",
  "method": "put",
  "headers": {
    "authorization": "bearer:{% credential OneLogin %}"
  }
}
Once we’ve logged out the victim, we now want to lock their account. With the account locked, we can safely perform additional investigation. As seen from the OneLogin API docs, we do this by setting the user’s “status” to 3 with another HTTP request Action. The corresponding options block is below:
{
  "url": "https://api.us.onelogin.com/api/1/users/{{.get_victim_details.body.data[0].id}}",
  "method": "put",
  "content_type": "json",
  "payload": {
    "status": "3"
  },
  "headers": {
    "authorization": "bearer:{% credential OneLogin %}"
  }
}
After reemitting an event and letting it rundown the Story, we confirm the account’s locked by viewing the victim’s profile.
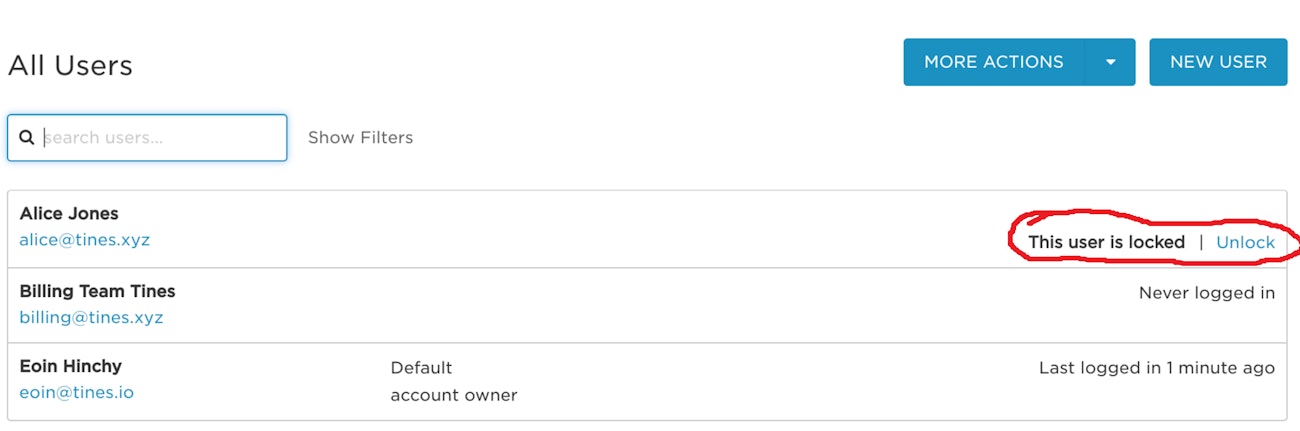
Locked user in OneLogin GUI
With the addition of these Actions, this section of our automation Story now looks as follows:
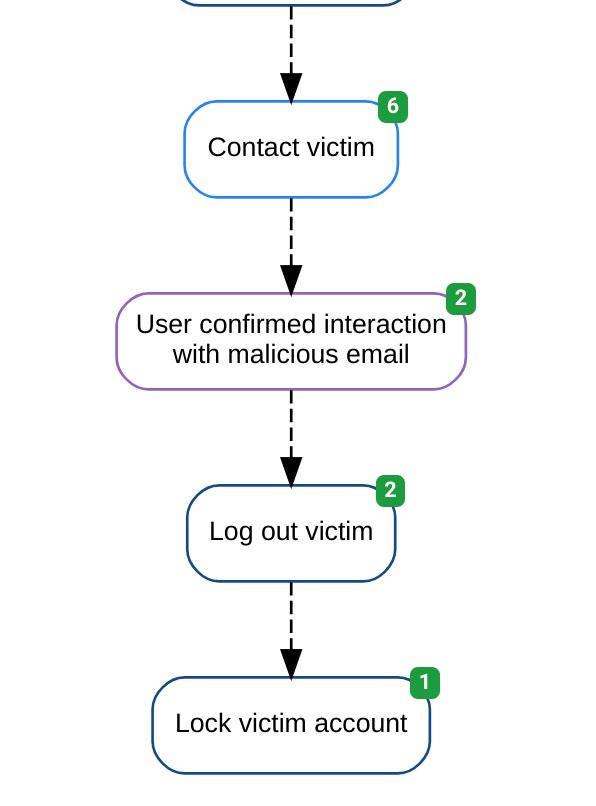
Account takeover automation diagram
Automating SIEM Searches (web proxy)
When an employee receives a malicious email, it’s quite likely that other employees will have been targeted in the same campaign. However, they may not have reported the email to the abuse inbox. Or worse, they may not have realized it was malicious and as a result actioned the email. As such, when security teams identify a malicious URL received by an employee, they will often search network logs (firewall, webproxy, etc.) to try and identify additional users that may have visited the malicious URL. We can automate this process with Tines.
Finding phishing domain
In our example, we’re collecting web proxy logs in Splunk:
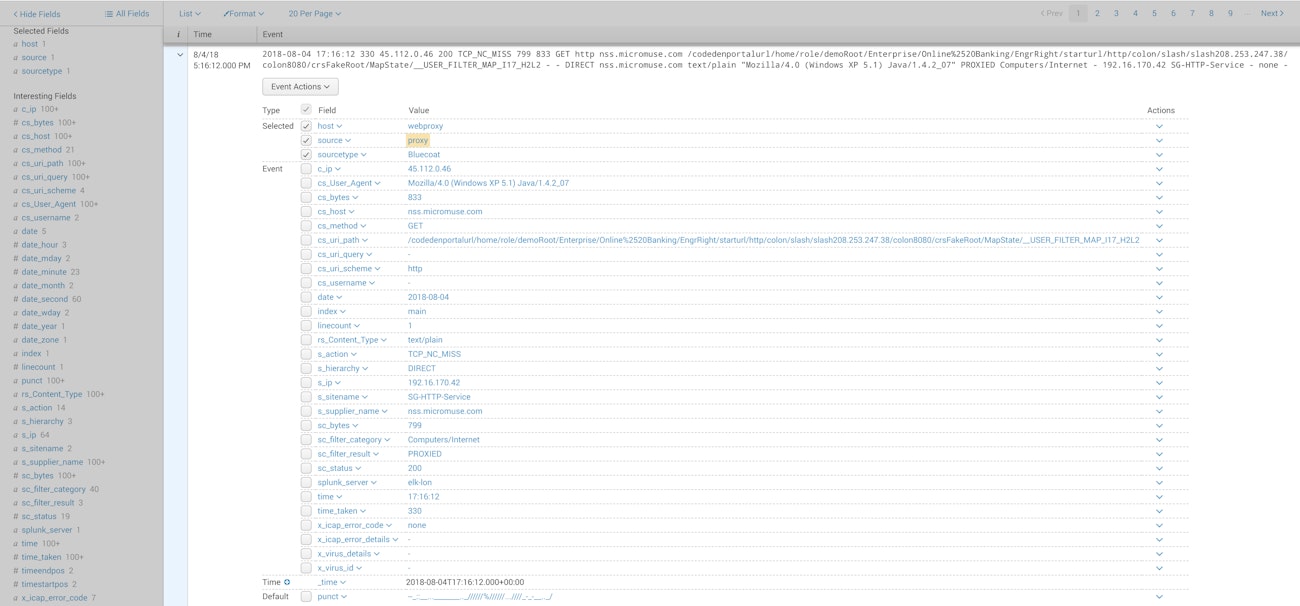
border--round box-shadow-wide vdw
Splunk indexes the domain visited by employees in a field called “cs_host”. By extracting the domain from the malicious URL and searching that field in Splunk, we can identify victims in our environment. We’ll use an Event Transformation Action in “Extract” mode to extract the domain from the malicious URL. The new Action will receive events from the existing “URL is malicious” Action, its options block is shown below:
{
  "mode": "extract",
  "matchers": [
    {
      "path": "{{.explode_urls.url}}",
      "regexp": "^(?:https?:\\/\\/)?(?:[^@\\n]+@)?(?:www\\.)?([^:\\/\\n?]+)",
      "to": "domain"
    }
  ]
}
TIP: When building complex regular expressions to use in an extract-mode Event Transformation Action, a regex testing service such as Rubular can be useful to help test and debug expressions. For example, http://rubular.com/r/6hOX7u0WCo
Automating Splunk searches
Next, we’ll use an HTTP request Action and the Splunk REST API to find any records of users visiting the extracted domain we’ve identified from the malicious URL. We’ll have this Action (named “Search SIEM for visits to malicious domain”) receive events from the “URL is malicious” Action.
See the Action options block below. Here, we’re using basic authentication with the credential widget, the POST method, and a form submission send the search to Splunk. We include the extracted domain in the search string. We are particularly interested in the source IP of the visiting user (contained in s_ip) and the time they visited. So, we include these in our search request.
{
  "url": "https://splunk.tines.xyz:8089/services/search/jobs",
  "content_type": "form",
  "method": "post",
  "payload": {
    "search": "search source=proxy host=webproxy sourcetype=Bluecoat {{.extract_domain.domain}}  | fields s_ip _time",
    "output_mode": "json"
  },
  "headers": {
    "Authorization": "Basic {% credential tinesio_splunk %}"
  }
}
When we dry-run this Action, we can see that Splunk returns a search id called “sid” which we can use to find the results of the search.
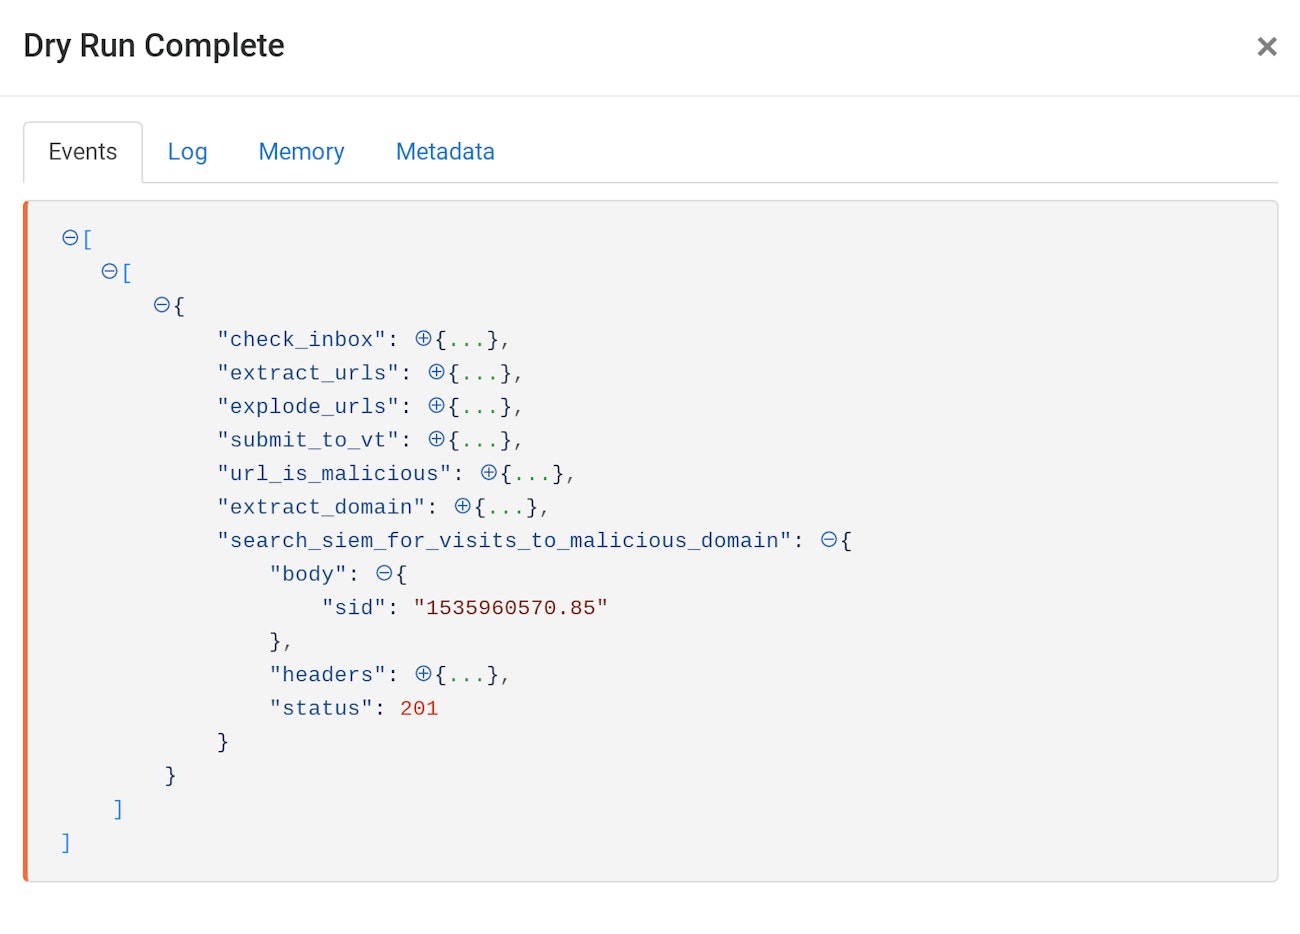
Splunk DHCP Search via REST API
Getting search status using Splunk REST API
We’ll use another HTTP Request Action, this time called “Get search status”, to determine if the search has been completed. As shown in the Action options block below, we’re submitting the sid via a GET request.
{
  "url": "https://splunk.tines.xyz:8089/services/search/jobs/{{.search_siem_for_visits_to_malicious_domain.body.sid}}?output_mode=json",
  "content_type": "json",
  "method": "get",
  "headers": {
    "Authorization": "Basic {% credential tinesio_splunk %}"
  }
}
This Action returns the status of the search in a field called “dispatchState”. A value of “DONE” indicates that the search is complete, a value of “RUNNING” means the search is still in progress.
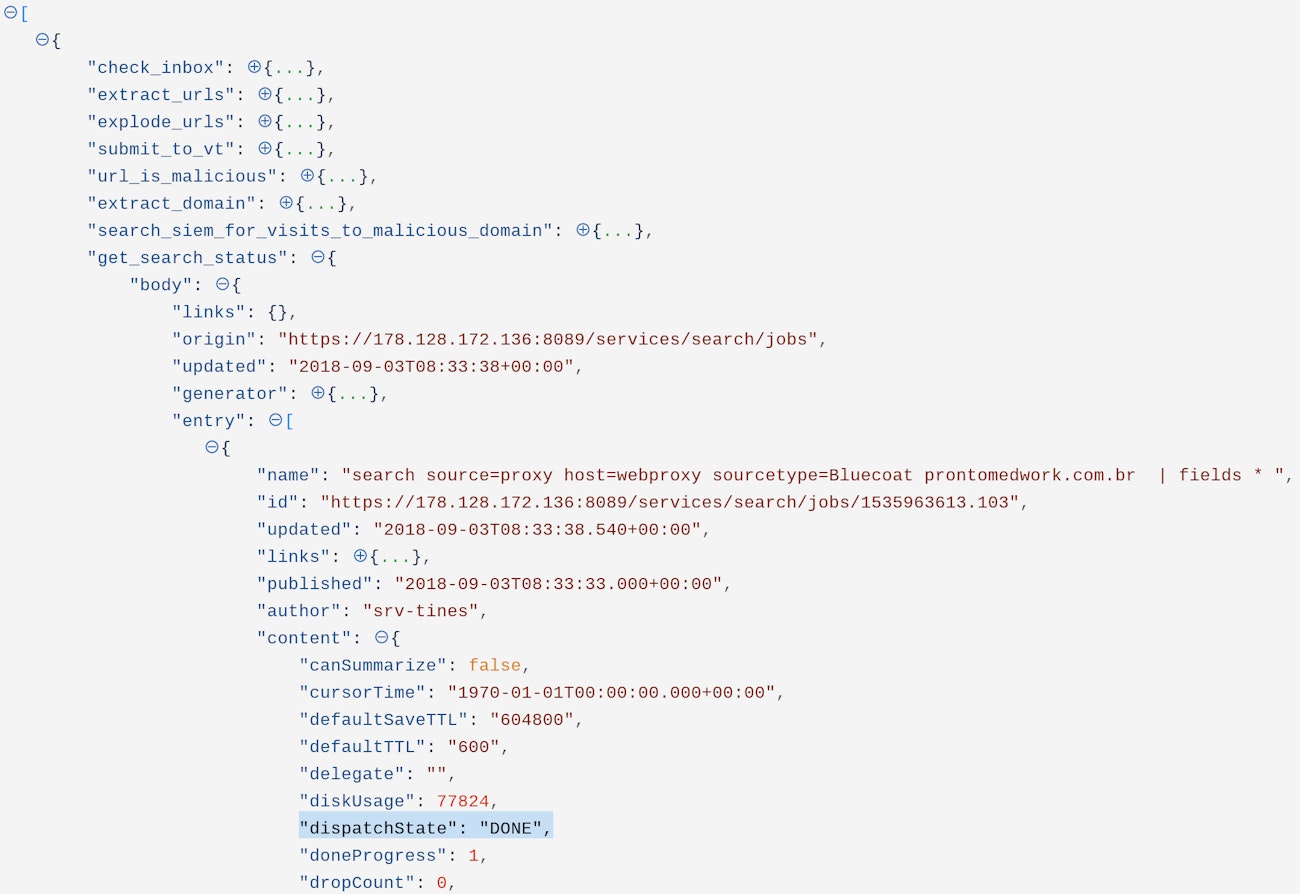
Splunk DHCP Search via REST API
Event emitted after checking Splunk search status
As with the URLScan and VirusTotal Actions in previous parts of this tutorial series, we’ll use a pair of Trigger Actions to:
Check again if the search is still running. We’ll call this Action “Search still in progress”
Emit an event if the search is complete. We’ll call this Action “Search complete”
See the configuration for both these Actions below:
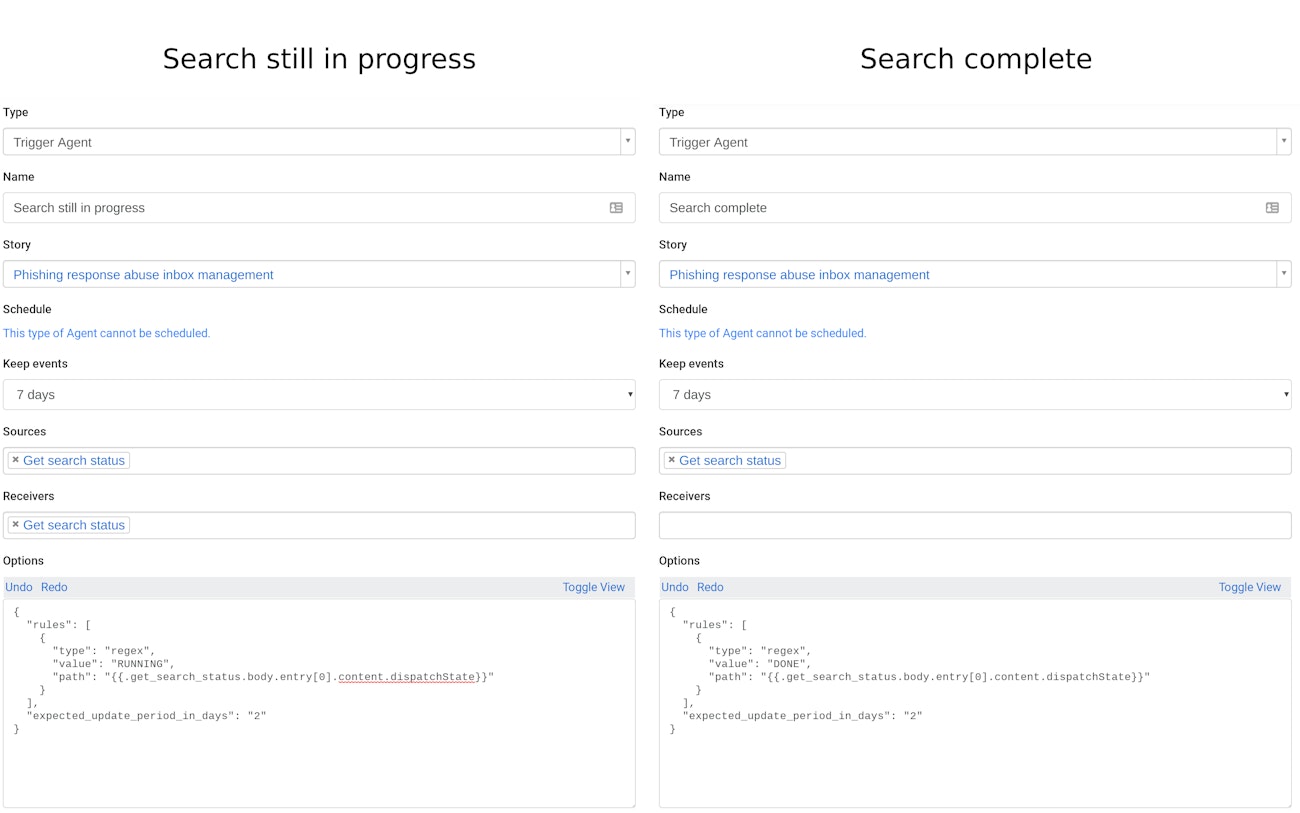
Configuration for search status trigger agents
Getting search results using Splunk REST API
When the search is complete, we can use another HTTP Request Action to get the search results. The options block for this action is shown below, it receives events from the “Search complete” trigger action.
{
  "url": "https://splunk.tines.xyz:8089/services/search/jobs/{{.search_siem_for_visits_to_malicious_domain.body.sid}}/results/",
  "content_type": "json",
  "method": "get",
  "headers": {
    "Authorization": "Basic {% credential tinesio_splunk %}"
  }
}
As Splunk returns a different structure when there are one result and multiple results, we’ll build two Trigger Actions to account for both cases. Their respective options blocks are shown below:
{
  "rules": [
    {
      "type": "field==value",
      "value": "1",
      "path": "{{.get_search_status.body.entry[0].content.eventCount}}"
    }
  ]
}
{
"rules": [
{
"type": "field>value",
"value": "1",
"path": "{{.get_search_status.body.entry[0].content.eventCount}}"
}
]
}Where there are multiple search results, we’ll configure an Event Transformation Action to explode the results so they can be treated individually. The options block for this Action, which we call “Explode search results is shown below”
{
  "mode": "explode",
  "path": "{{.get_search_results.body.results.result}}",
  "to": "result"
}
Every time the malicious domain was visited from our environment, we now have access to the source IP address and time of the visit. After our updates, this section of our Story looks like the below:
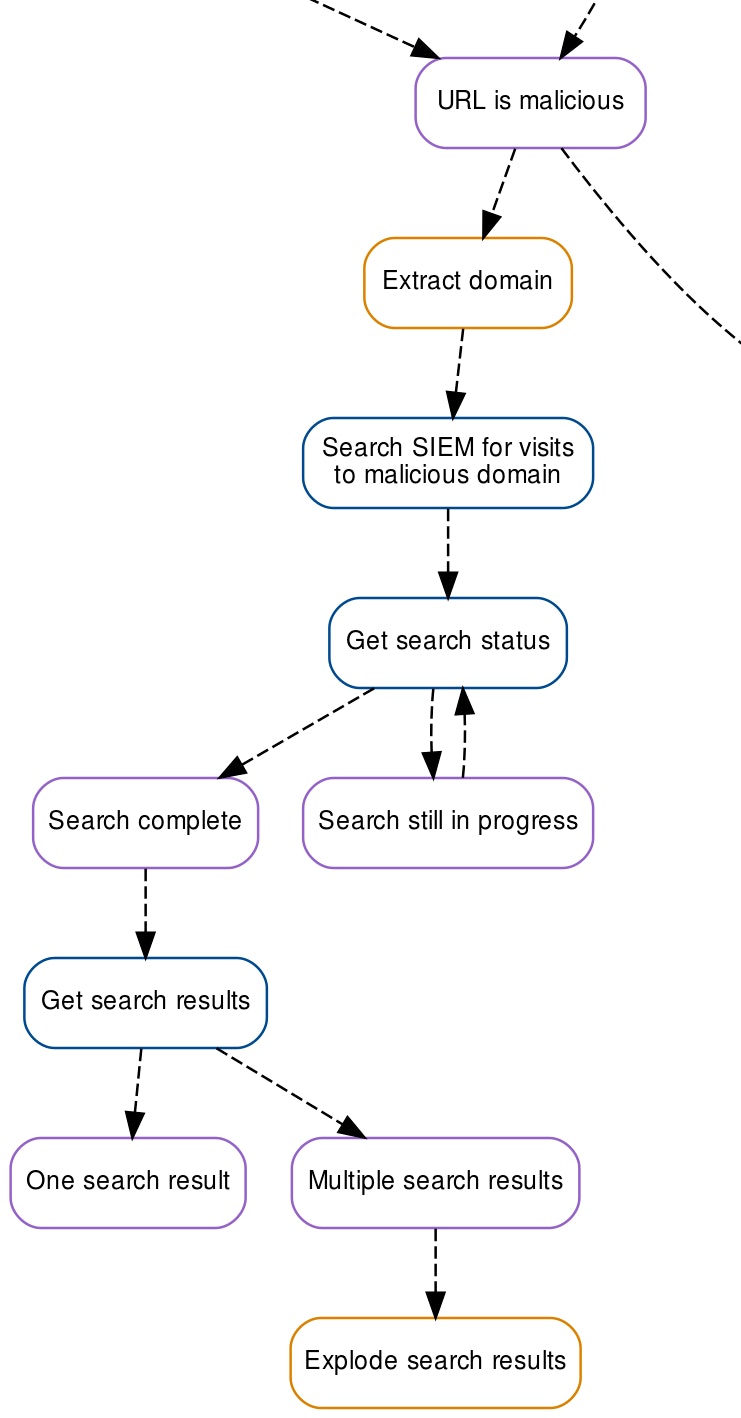
Automated SIEM searches diagram
Automating SIEM searches (DHCP)
Unfortunately, the web proxy in our example does not log the asset name or the user that visited the malicious domain. The only information we have to determine this critical context is the source IP address and the time of the visit. Thankfully, we also store DHCP logs in Splunk, so we can automate the collection of the host (asset) name with Tines.
DHCP logs in Splunk
As the response from Splunk is slightly different when there are single and multiple results, see below, we’ll use a pair of HTTP Request Actions which will receive events from the “One search result” and “Explode search results” Actions respectively. The options blocks for these Actions are similar, the “Get host from DHCP logs single result” is shown below:
{
  "url": "https://splunk.tines.xyz:8089/services/search/jobs",
  "content_type": "form",
  "method": "post",
  "payload": {
    "search": "search host=dhcp \"IP Address\"={{.get_search_results.body.results.result.field[0].value.text}} (Description=New OR Description=Renew) | head 1 | fields \"Host Name\"",
    "output_mode": "json",
    "earliest_time": "{{.get_search_results.body.results.result.field[1].value.text | date: '%s' | minus: 43200}}",
    "latest_time": "{{.get_search_results.body.results.result.field[1].value.text | date: '%s'}}"
  },
  "headers": {
    "Authorization": "Basic {% credential tinesio_splunk %}"
  }
}
Breaking down Splunk API search
This agent is slightly more complex than our previous HTTP Request Actions, so let’s unpack the payload being submitted with a POST to Splunk:
search: We want to find DHCP logs that are related to the identified source IP Address which we take from incoming events. As we want to find the machine which was assigned the IP, we only look at logs related to ‘New’ or ‘Renew’ leases. By specifying “head 1”, we’re taking the most recent event within our specified time range, that is the last asset with the IP address. Finally, we want the asset name in question, so we specify that field via “fields “Host Name””
output_mode: Here we tell Splunk to use the JSON encoding scheme.
earliest_time: We want to know what machine received/renewed the IP address before the user visited the malicious domain. We do this with Splunk’s earliest_time parameter. We take the timestamp of the visit to the malicious domain and convert it into a UNIX epoch time with the date liquid filter: date: ‘%s’. Next, we use the minus liquid filter to subtract 12 hours (43200 seconds) from the time the user visited the malicious domain, this should be sufficient to find a relevant DHCP event.
latest_time: We set the upper time limit of the search to the time the user visited the malicious site. In our case, the IP assignee does not matter after this point.
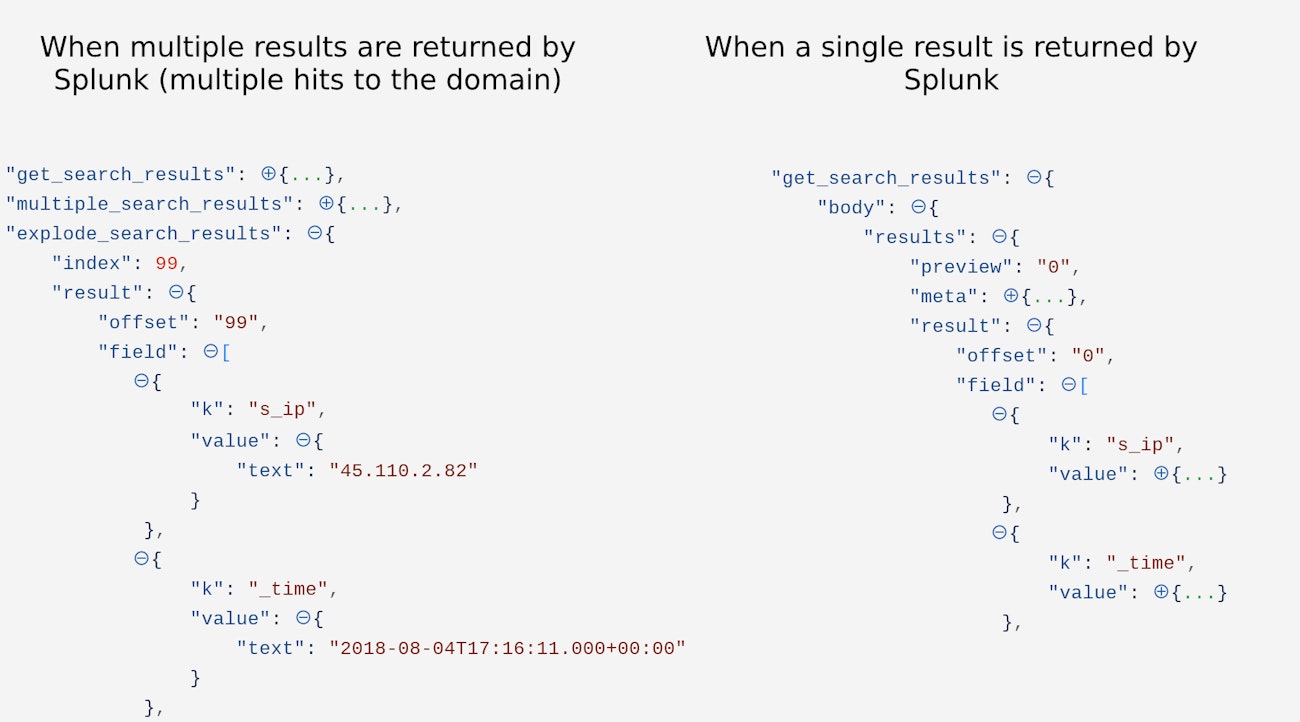
Difference between single and multiple Splunk event results
Getting status of DHCP search in Splunk
As with the web proxy search, we’ll use a combination of HTTP Request Actions and Trigger Actions to monitor the status of the search and fetch the results when it’s complete.
When the search successfully identifies the Host the event will look similar to the below:
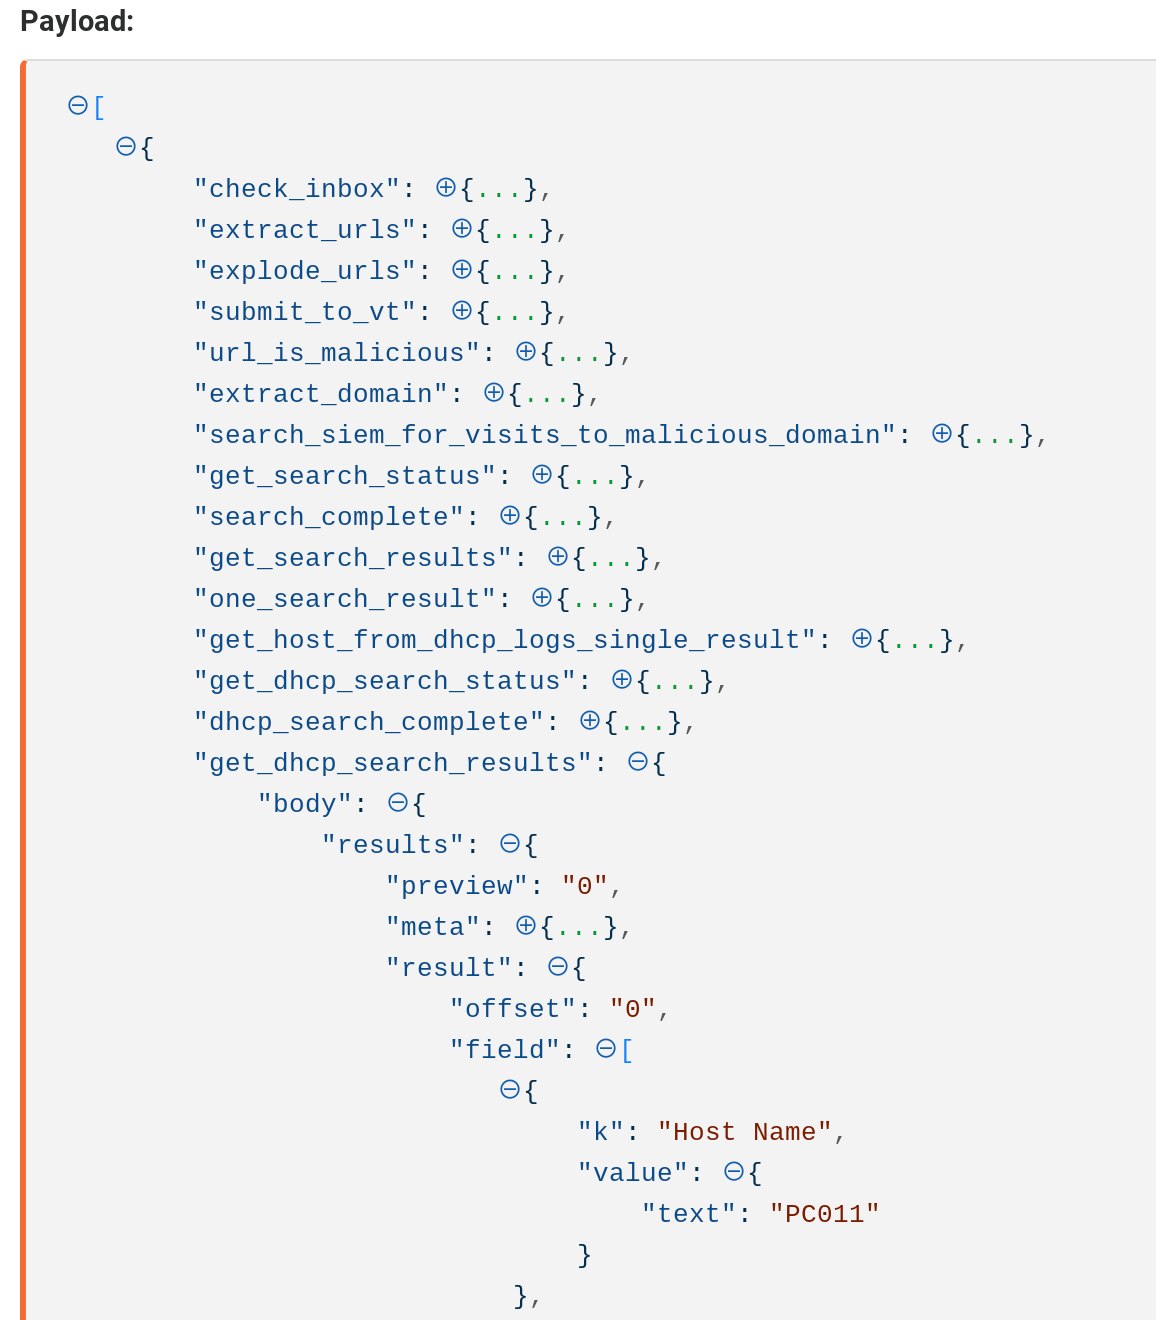
Event emitted after matching host identified
Next, we’ll include a trigger Action to detect if the search failed to return any results. This tells us a machine could not be found to match the visit to the malicious domain. We’ll do this with a Trigger Action and use a corresponding Trigger Action for when a result was returned. We could create an email Action to notify us when the DHCP search failed to get a result.
{
  "rules": [
    {
      "type": "field==value",
      "value": "0",
      "path": "{{.get_dhcp_search_status.body.entry[0].content.eventCount}}"
    }
  ]
}
{
"rules": [
{
"type": "field>value",
"value": "0",
"path": "{{.get_dhcp_search_status.body.entry[0].content.eventCount}}"
}
]
}We’ve now collected the machine name. With this, we could isolate the machine from the network, take a forensic image, or perform additional log searches to collect other relevant context.
Automating asset management with Jira
We suspect that a user in our environment visited a malicious site. As such, we need to remediate the risk of their account bring compromised. For this, we need to retrieve the user associated with the asset we have identified through proxy and DHCP logs.
In our example, we have a dedicated Asset Management project in JIRA which contains all asset information in our environment.
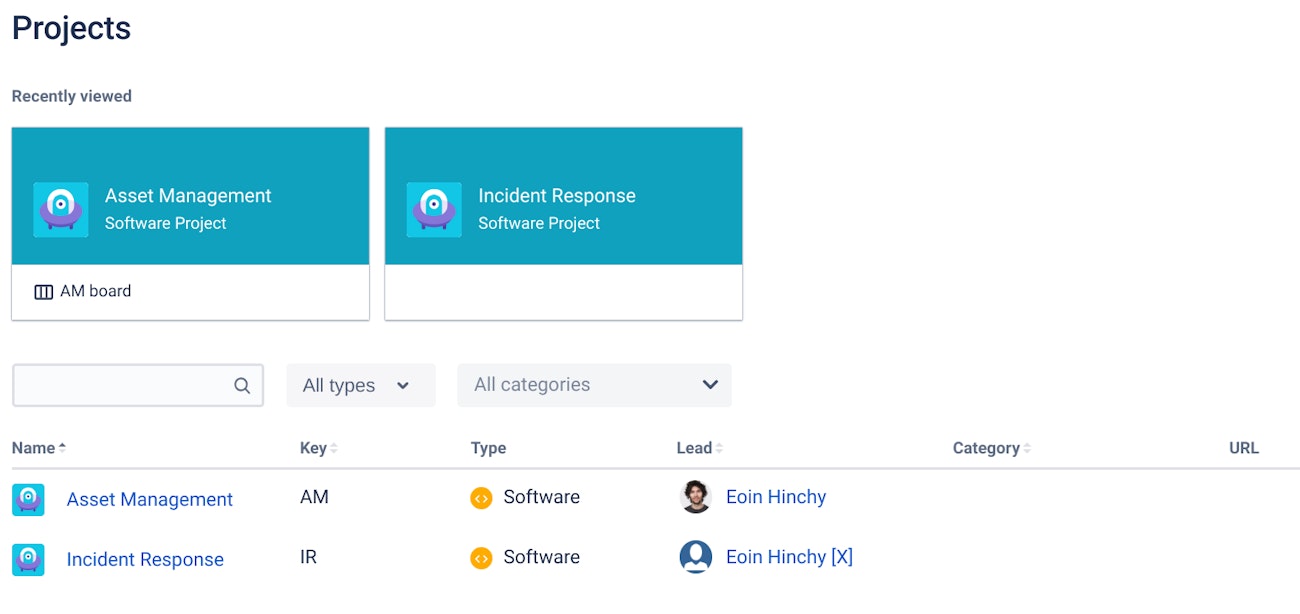
Asset Management Project in Jira
We’ll use an HTTP Request Action to fetch the asset owner from Jira. We’ll call this Action “Get asset owner” and configure it to receive events from the “Found matching host” Trigger Action. This Action uses the JIRA Search API to find entries in the Asset Management JIRA project (AM) where the “Asset ID” field matches the hostname value found in Splunk. We authenticate to JIRA using basic authentication.
{
  "url": "https://tinesio.atlassian.net/rest/api/2/search",
  "content_type": "json",
  "method": "post",
  "payload": {
    "jql": "project=AM AND 'Asset ID' ~ {{.get_dhcp_search_results.body.results.result.field[0].value.text}}"
  },
  "basic_auth": [
    "eoin@tines.io",
    "{% credential tinesio_jira %}"
  ]
}
When this Action runs, it will emit an event similar to the below. The field we’re most interested in is the assignee’s email address. This represents the owner of the asset and the account we need to remediate. In our case billing@tines.xyz.
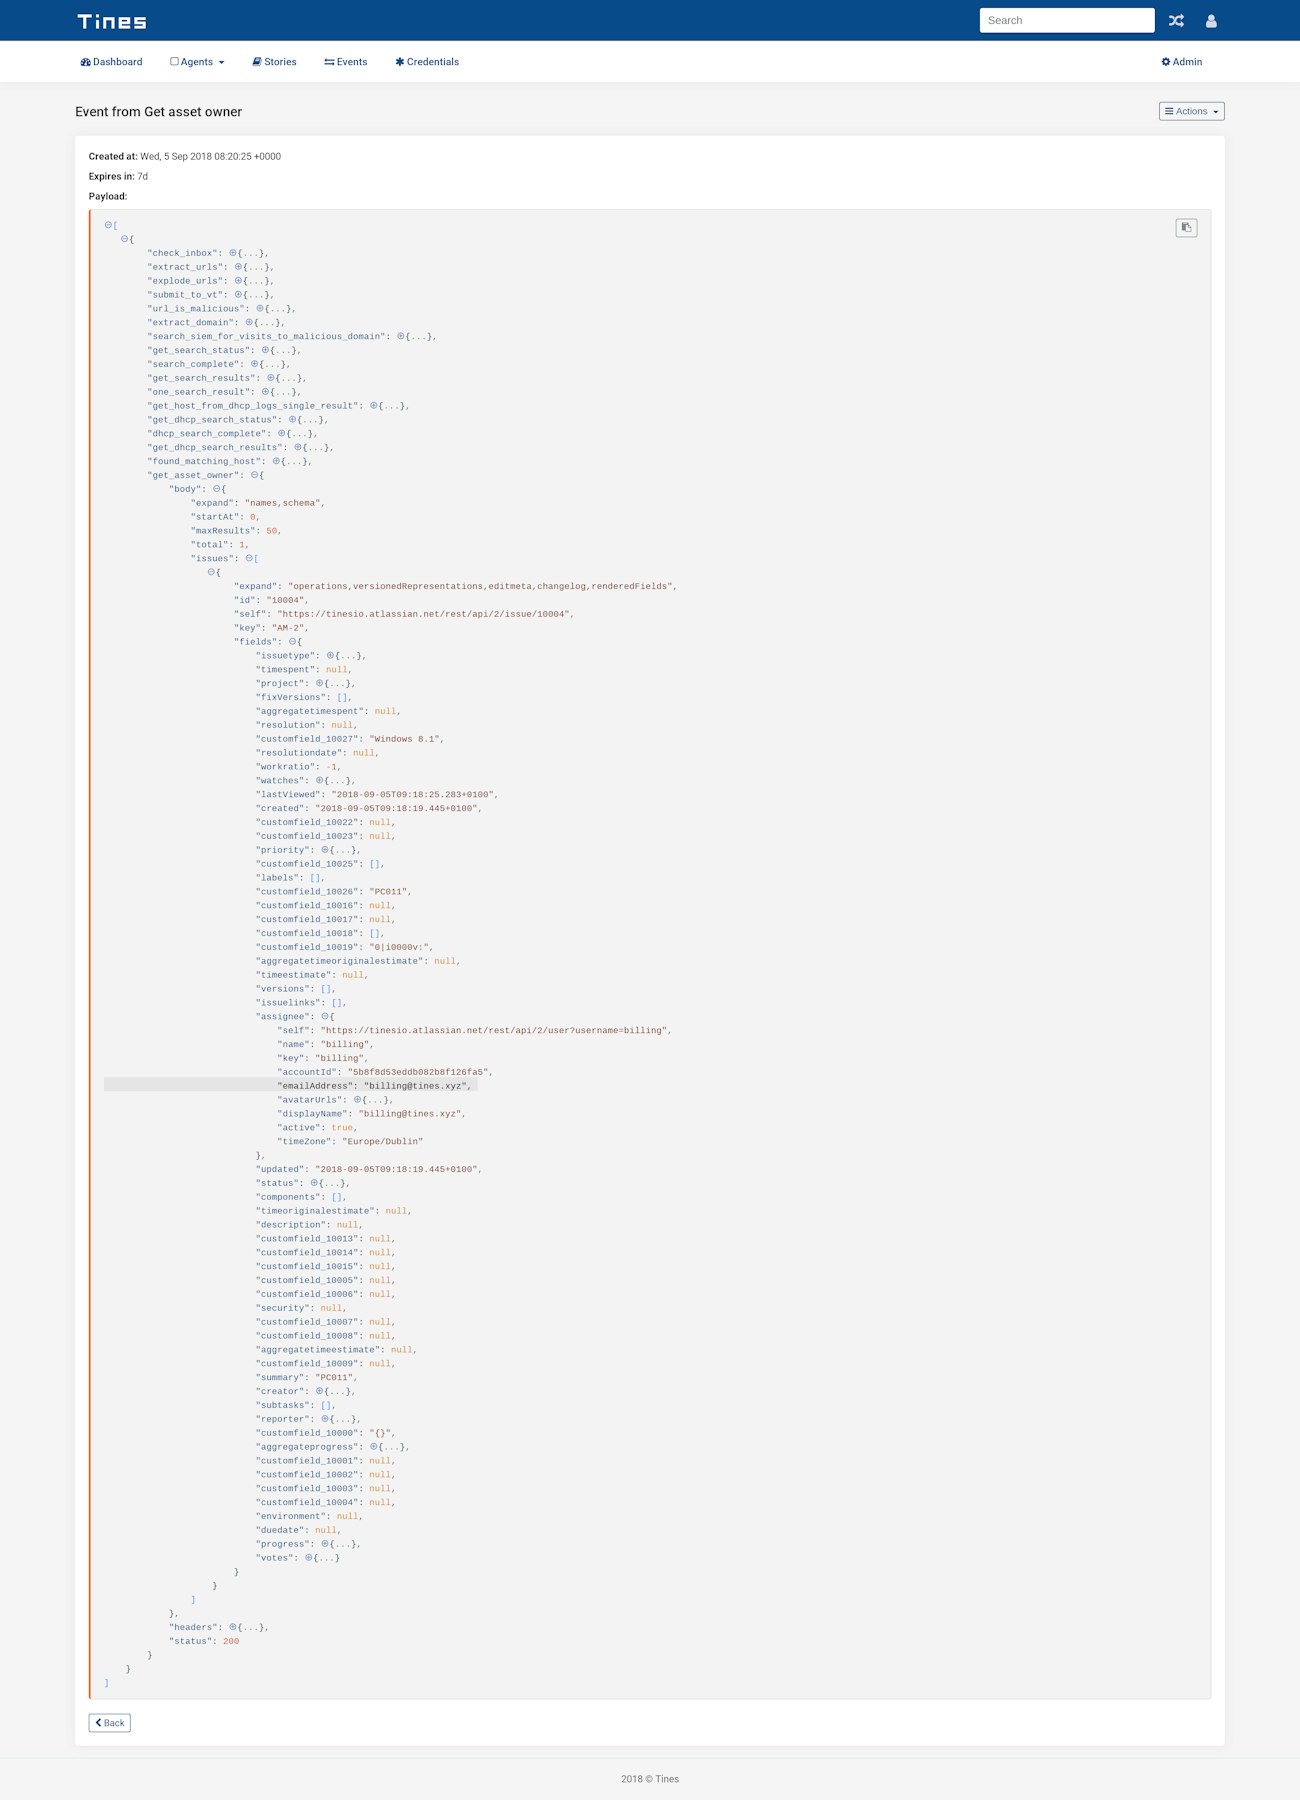
Event from JIRA REST API
We’ll reuse the Actions we created previously to interact with OneLogin. You’ll recall that they fetch additional user information, log out the user, and lock their account.
Our final Story diagram is below:
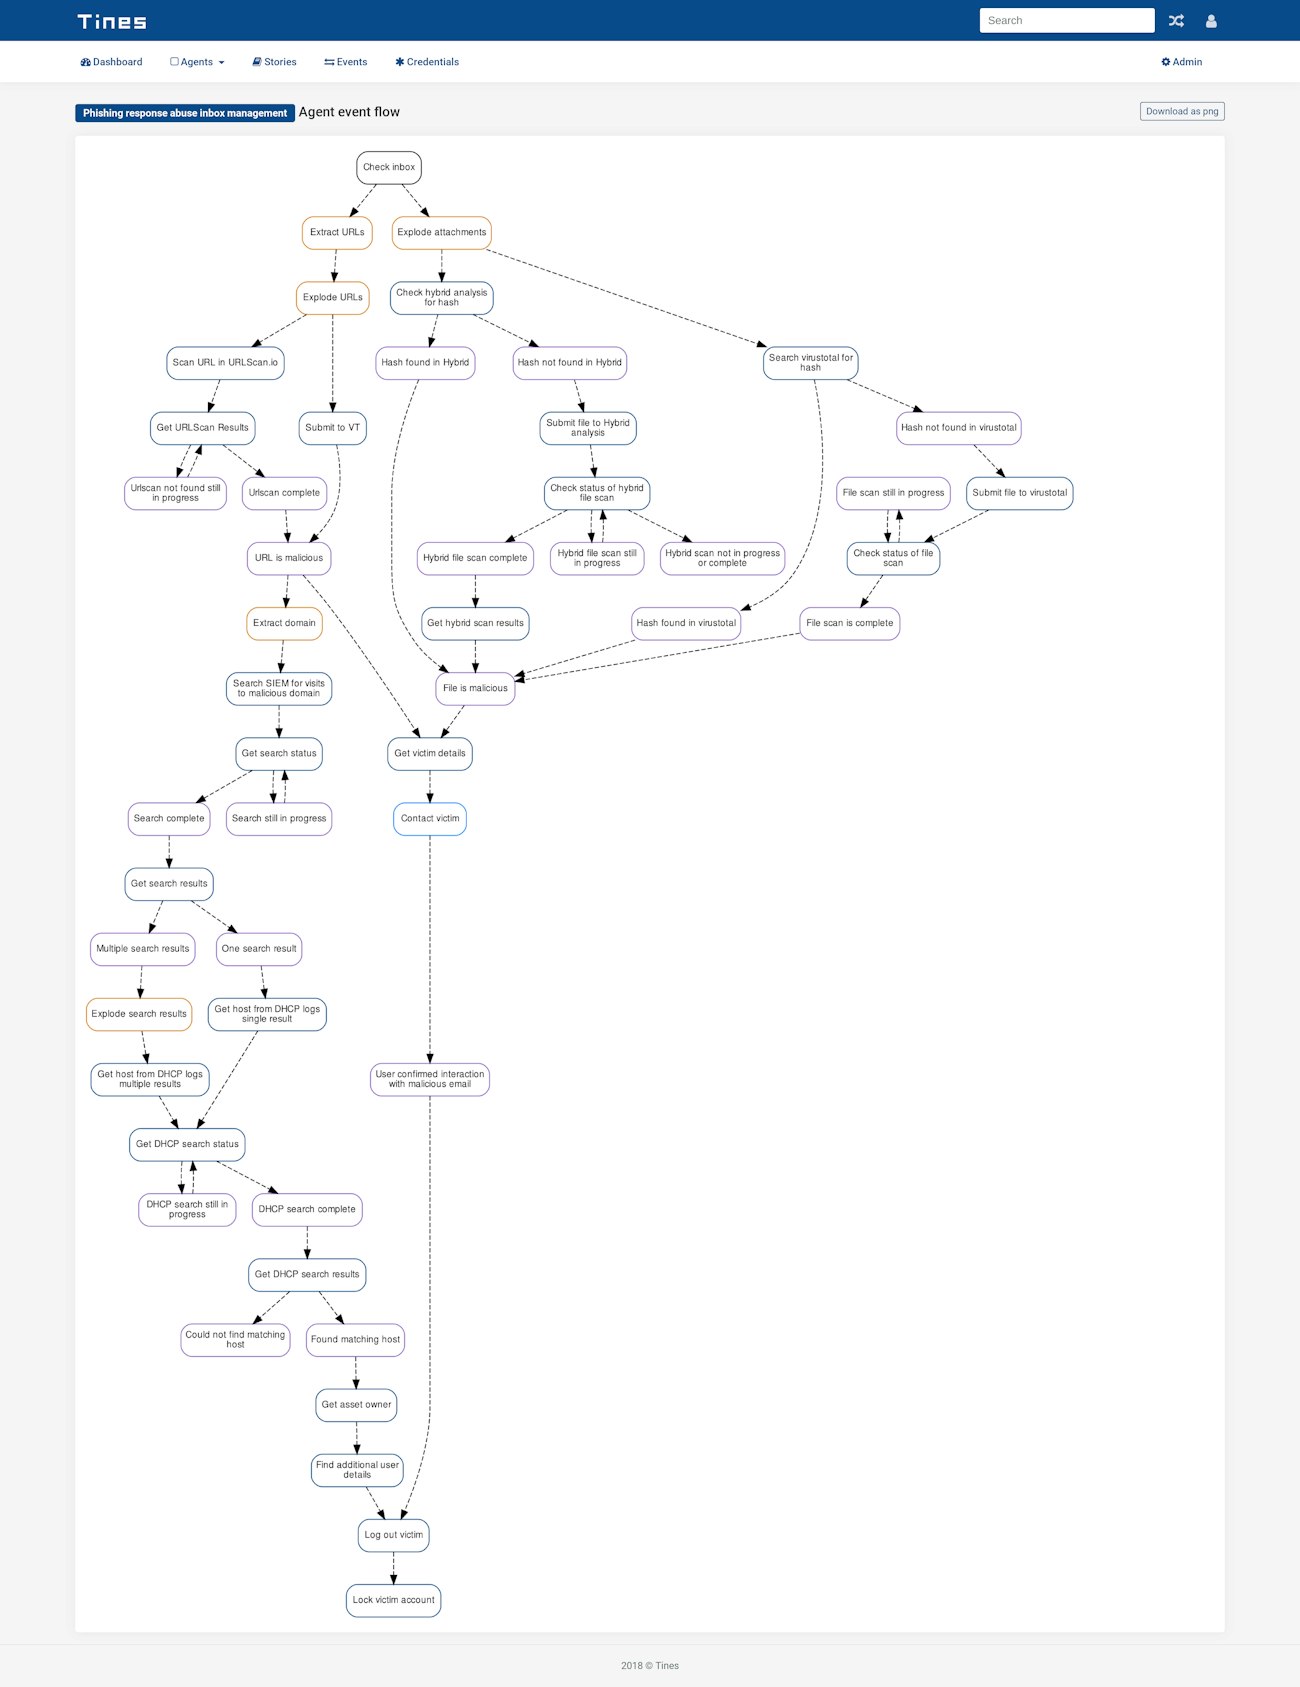
Automated phishing response diagram
Conclusion
Over the course of this series, we’ve significantly evolved our automation Story. From a simple five-Action Story that analyzed emails, to a comprehensive story containing over 50 Actions. We’ve automated analysis of email links and attachments, determination of threat level, user activity confirmation, SIEM searches, and more. However, in many ways, we could view this Story as a jumping-off point for an even more capable story. We didn’t touch on case management, DMARC, or additional threat hunting.
By automating this process in Tines, we have complete visibility into every step of the Story. We also have unprecedented ability to expand, troubleshoot and scale.
Resources
Tutorial series: Automating abuse inbox management and phishing response (Part 1) Tutorial series: Automating abuse inbox management and phishing response (Part 2) Importable Story file
*Please note we recently updated our terminology. Our "agents" are now known as "Actions," but some visuals might not reflect this.*