


Introduction
To monitor for suspicious activity and gain operational awareness in the cloud, modern detection and response teams must process and analyze large volumes of log data from applications, networks, hosts, and cloud infrastructure. An end-to-end workflow typically involves analyzing logs, generating alerts, and taking action to determine whether the activity is either a true or false positive.
Historically, security teams had to manually review alerts and take steps to determine whether the activity was a real indicator of compromise. But as organizations move to the cloud and data volumes explode, adding automation can help security teams increase efficiency and scale their efforts.
In this blog post, we’ll outline how security teams can use Panther and Tines to generate real-time alerts on suspicious activity, get answers from end-users, enrich data, and leverage automation to save time to focus on the issues that matter most: improving the security of your organization.
You can also watch our on-demand webinar to learn how to automate detection and response with Panther and Tines.
Threat scenario
For this scenario, we’ll analyze Okta SSO logs with Panther and send an alert each time a user is granted Administrator privileges in Okta. Because SSO is the gateway for accessing internal systems, delegating Admin privileges should be highly scrutinized.
Alerts will be sent from Panther to Tines via a webhook to initiate an automated response workflow that will:
Check whether the client IP is malicious
Ping the user on Slack to confirm the behavior
Depending on the user's response, create a new case and lock the account
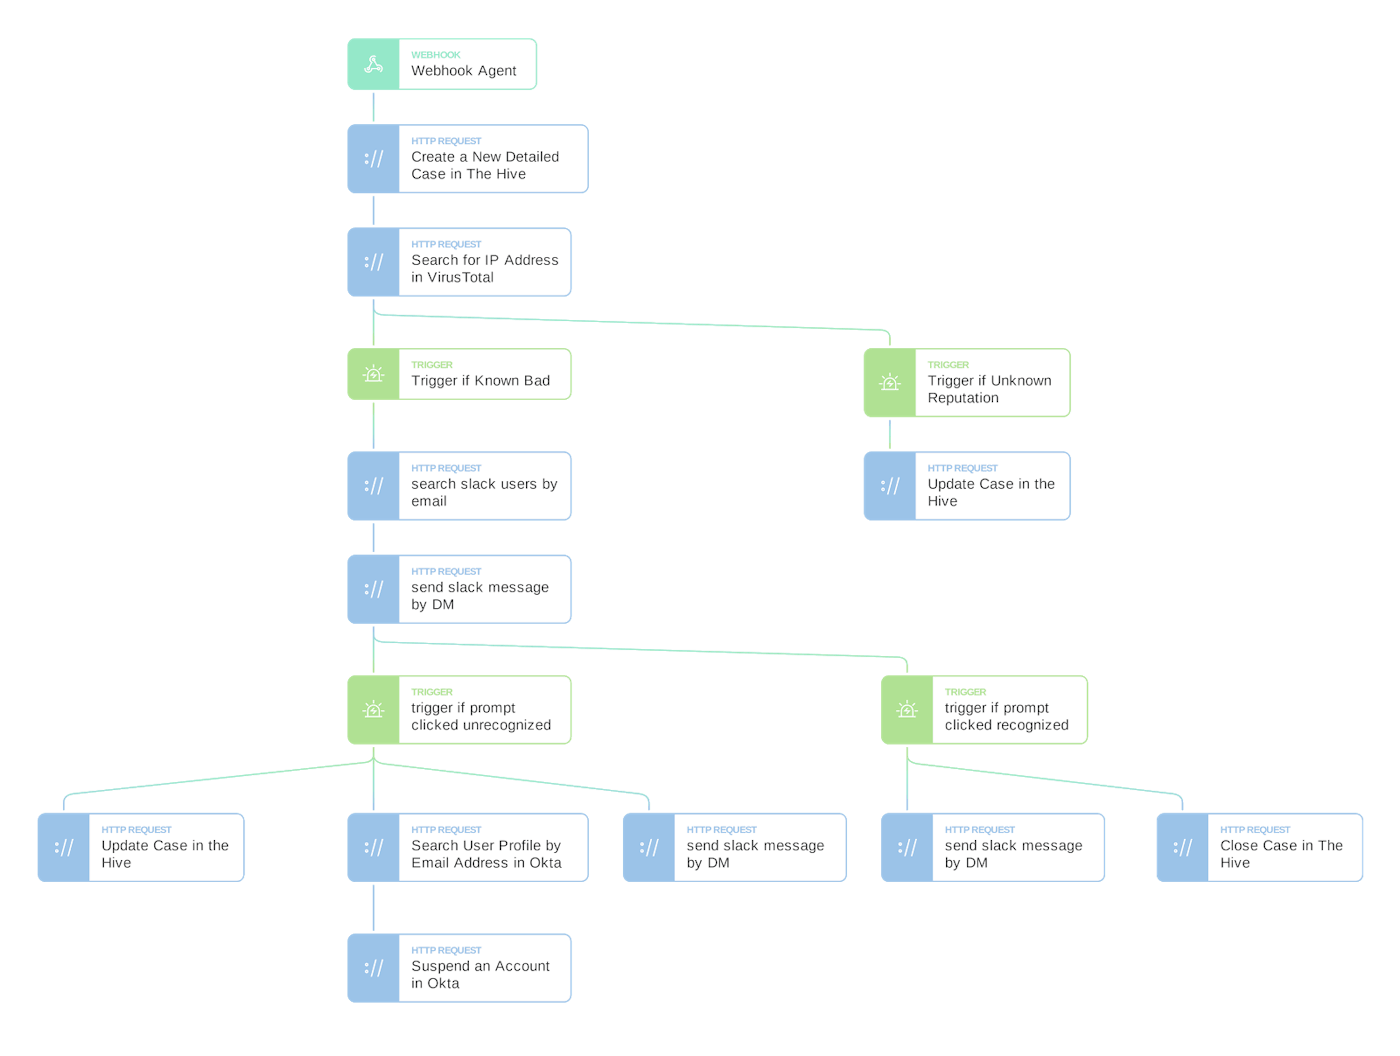
The end-to-end workflow will look like this:
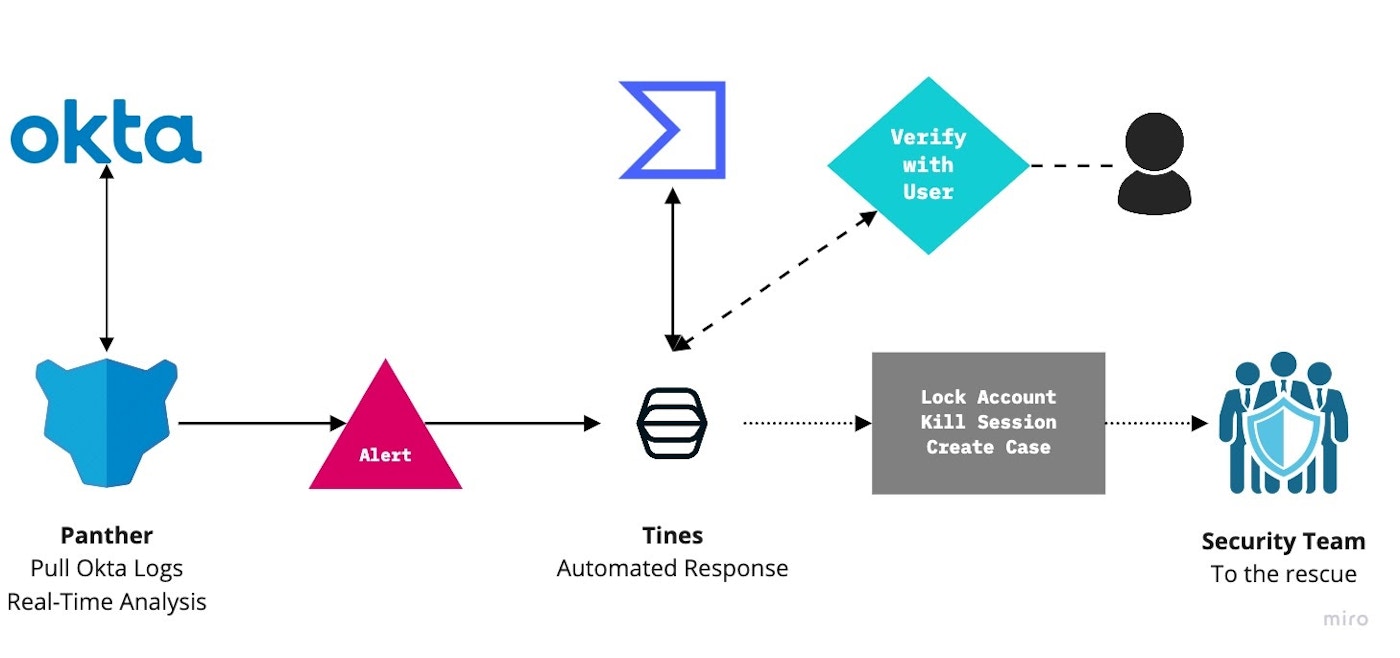
The goal of this workflow is to proactively prevent an attacker from escalating privileges and causing harm to your organization.
Collecting and monitoring Okta logs
The first step is to gather and analyze Okta logs. With an API token, Panther can be configured to pull this data as soon as new logs are available.
Simply add a new Source in Panther:
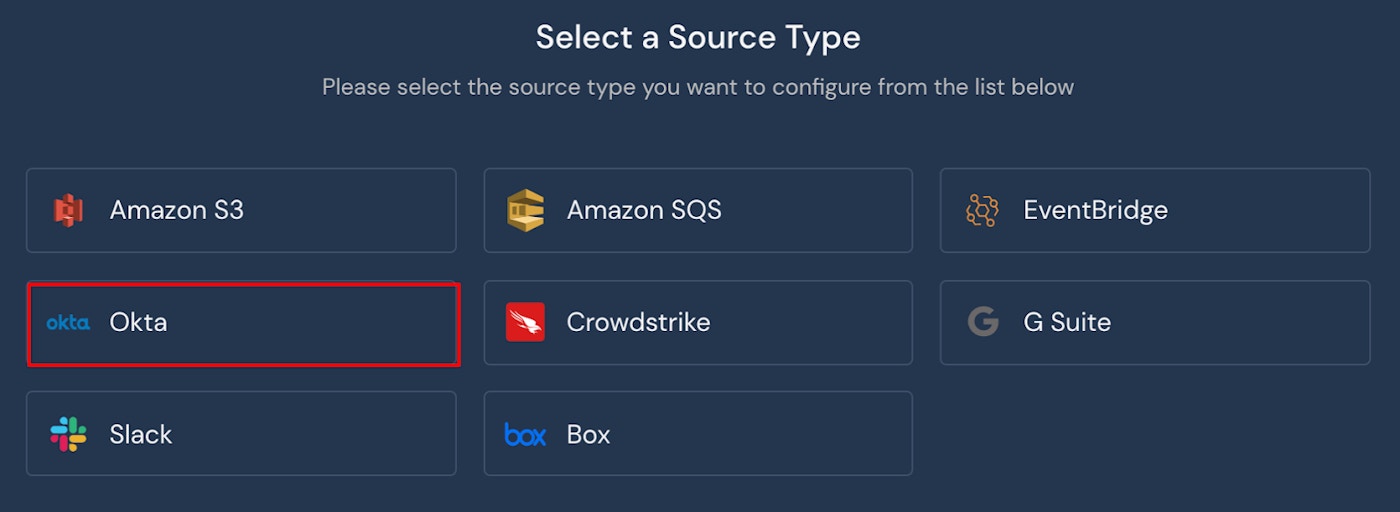
Configure Panther to pull Okta log data
And add your Okta API details:
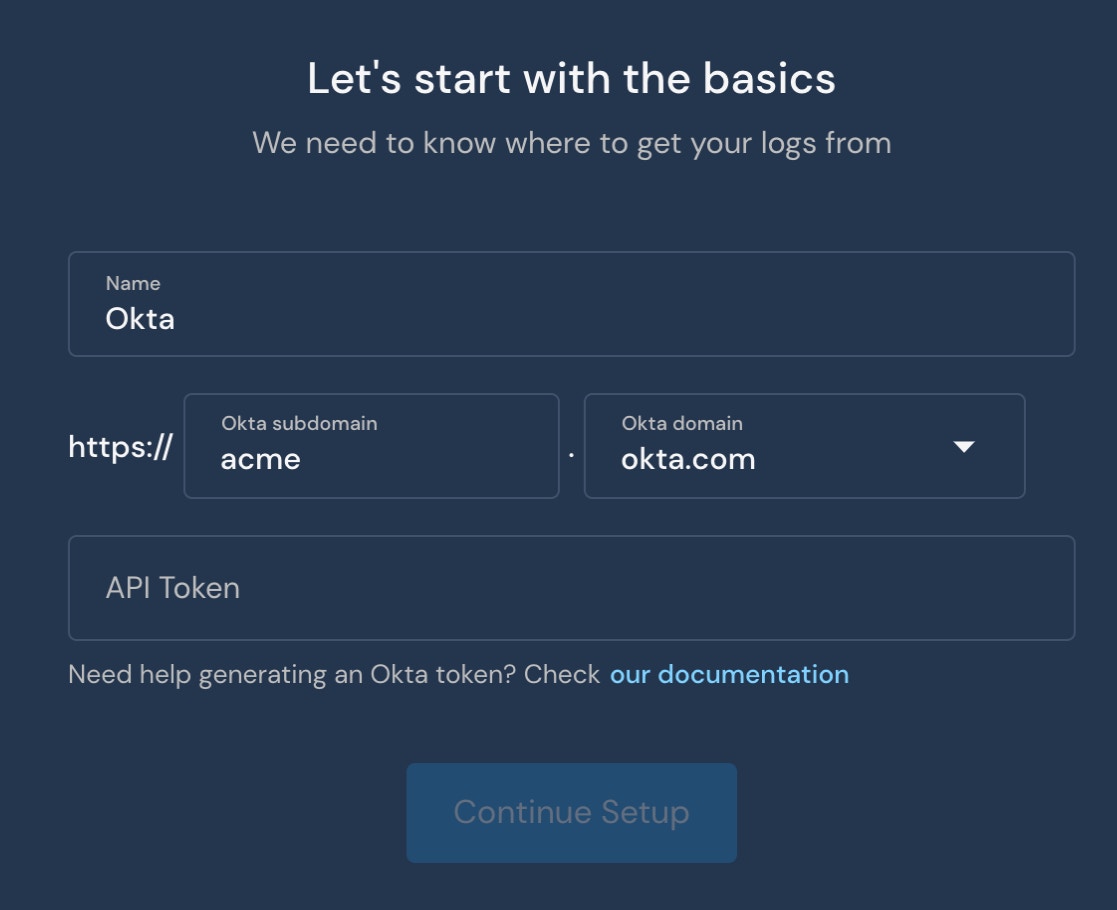
Add your Okta details to finish the configuration
Now, Panther will poll Okta for new logs each minute. The log below is an example Okta log that we will monitor:
{
	"uuid": "2a992f80-d1ad-4f62-900e-8c68bb72a21b",
	"published": "2020-11-25 21:27:03.496000000",
	"eventType": "user.account.privilege.grant",
	"version": "0",
	"severity": "INFO",
	"legacyEventType": "core.user.admin_privilege.granted",
	"displayMessage": "Grant user privilege",
	"actor": {
		"id": "00uu1uuuuIlllaaaa356",
		"type": "User",
		"alternateId": "jack.naglieri@runpanther.io",
		"displayName": "Jack Naglieri"
	},
	"client": {
		"userAgent": {
			"browser": "CHROME",
			"os": "Mac OS X",
			"rawUserAgent": "Mozilla/5.0 (Macintosh; Intel Mac OS X 10_15_7) AppleWebKit/537.36 (KHTML, like Gecko) Chrome/86.0.4240.198 Safari/537.36"
		},
		"geographicalContext": {
			"geolocation": {
				"lat": 48.8916,
				"lon": 2.7939
			},
			"city": "Coupvray",
			"state": "Ile-de-France",
			"country": "France",
			"postalCode": "77700"
		},
		"zone": "null",
		"ipAddress": "194.88.246.242",
		"device": "Computer"
	},
	"request": {},
	"outcome": {
		"result": "SUCCESS"
	},
	"target": [
		{
			"id": "00u6eup97mAJZWYmP357",
			"type": "User",
			"alternateId": "thomaskinsella@tines.io",
			"displayName": "Thomas Kinsella"
		}
	],
	"transaction": {},
	"debugContext": {
		"debugData": {
			"privilegeGranted": "Organization administrator, Application administrator (all)",
			"requestUri": "/api/internal/administrators/00u6eu8c68bb72a21b57",
			"threatSuspected": "false",
			"url": "/api/internal/administrators/00u6eu8c68bb72a21b57",
			"requestId": "X777JJ9sssQQHHrrrQTyYQAABBE"
		}
	},
	"authenticationContext": {},
	"securityContext": {}
}
Once these logs have been processed and normalized by Panther, they can be queried with SQL to review similar past events so that we can understand what ‘normal’ activity looks like, and ultimately, write high-fidelity detections.
For example, if Panther is configured with Snowflake as the data store, the following query will display all previous events where an account was granted administrator privileges:
SELECT *FROM panther_logs.public.okta_systemlog
WHERE eventType = 'user.account.privilege.grant'
AND outcome:result = 'SUCCESS'
AND debugContext:debugData:privilegeGranted LIKE '%dministrator'
Now that we understand how to work with the data once it’s collected, let’s convert this query to a Panther real-time Python rule.
Generating high-value alerts
In this scenario, our objective is to generate an alert each time a new user is granted “Administrator” privileges in Okta. In the previous event, we saw the following:
Who: Jack Naglieri is granting Organization & Application Administrator
To: Thomas Kinsella
From: IP 194.88.246.242
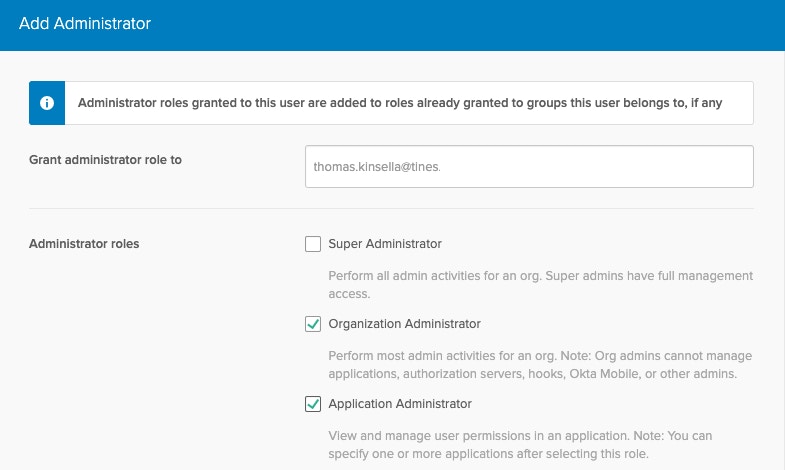
Delegating Admin privileges in Okta
In Panther, we can enable the following built-in rule to flag these events:
import re

def rule(event):
    return (
        event['eventType'] == 'user.account.privilege.grant' and
        event['outcome'].get('result', '') == 'SUCCESS' and bool(
            re.search(
                r'[aA]dministrator',
                event['debugContext']['debugData'].get('privilegeGranted'))))
When true is returned from the rule() function, an alert will be generated for the security team to review.
Each alert includes a high-level overview, a summary of common attributes across all alert-generating events, and the normalized event logs that triggered the alert.
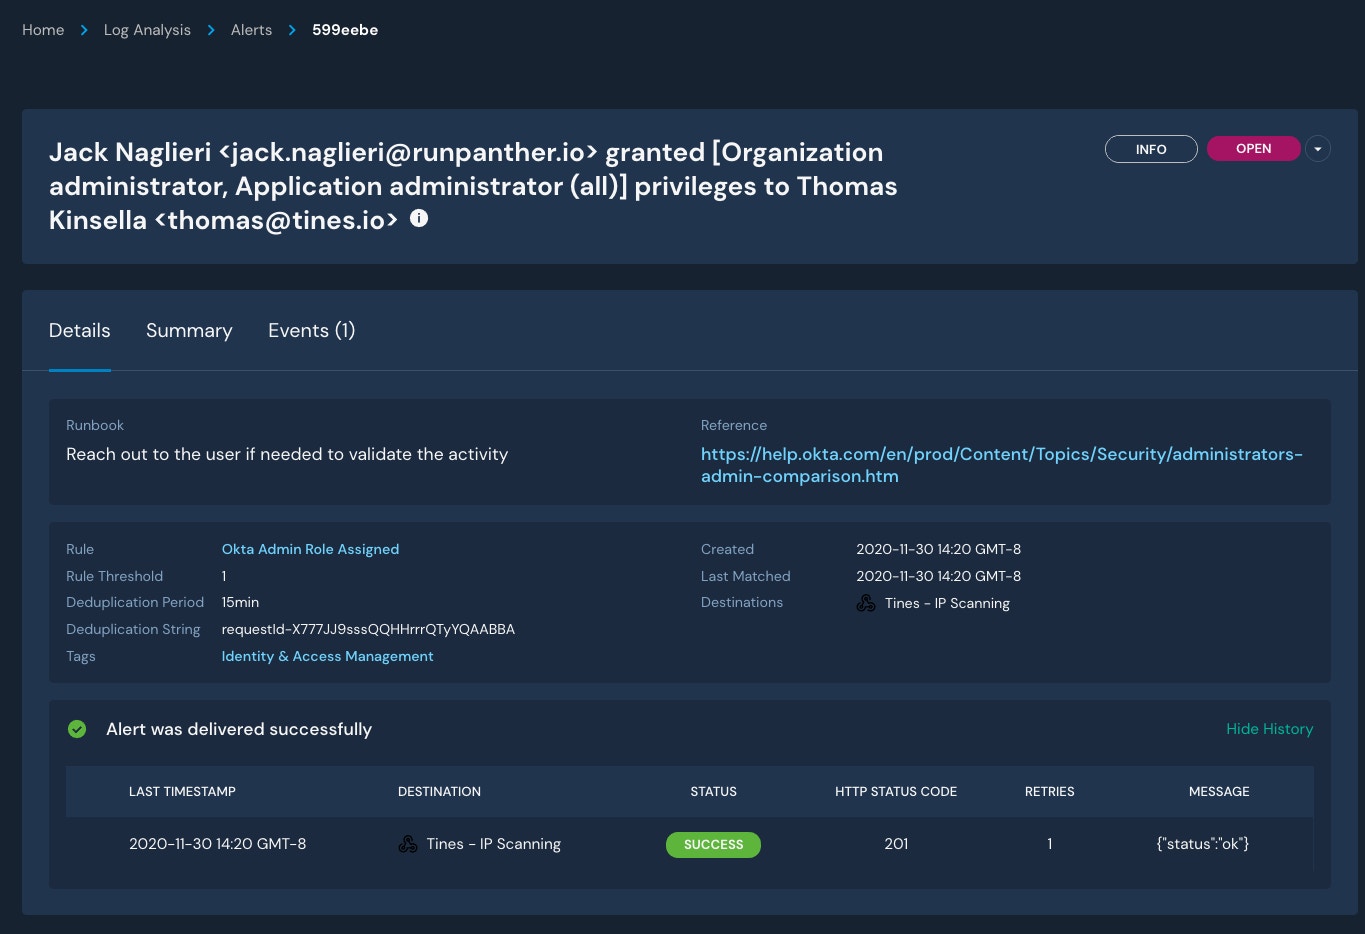
Review details for an alert
To save time and build repeatable processes for triaging alerts, a platform like Tines is utilized to automate follow-up actions that may help resolve these alerts without manual intervention.
Adding context for powerful automation
To build intelligent and robust automation, Tines can use events from generated alerts to respond accordingly. In Panther, security analysts can build their detections with automation in mind by leveraging the alert_context() function to include arbitrary JSON data, such as event metadata, in the alert.
In this case, we add the following code to our rule to include in our alert the user triggering the activity (actor), the receiving user (target), metadata about the actor request (client), and all detected IPs (from Panther’s standard fields):
def alert_context(event):
    return {
        'ips': event.get('p_any_ip_addresses', []),
        'actor': event['actor'],
        'target': event['target'],
        'client': event['client'],
    }
The generated context is appended to alert events in a key called p_alert_context, and when the JSON is loaded, looks like this:
{
  "ips": [
    "194.88.246.242"
  ],
  "actor": {
    "id": "00uu1uuuuIlllaaaa356",
    "type": "User",
    "alternateId": "jack.naglieri@runpanther.io",
    "displayName": "Jack Naglieri"
  },
  "target": [
    {
      "id": "00u6eup97mAJZWYmP357",
      "type": "User",
      "alternateId": "thomas@tines.io",
      "displayName": "Thomas Kinsella"
    }
  ],
  "client": {
    "userAgent": {
      "browser": "CHROME",
      "os": "Mac OS X",
      "rawUserAgent": "Mozilla/5.0 (Macintosh; Intel Mac OS X 10_15_7) AppleWebKit/537.36 (KHTML, like Gecko) Chrome/86.0.4240.198 Safari/537.36"
    },
    "geographicalContext": {
      "geolocation": {
        "lat": 37.7852,
        "lon": -122.3874
      },
      "city": "Coupvray",
      "state": "Coupvray",
      "country": "France",
      "postalCode": "77700"
    },
    "zone": "null",
    "ipAddress": "194.88.246.242",
    "device": "Computer"
  }
}
Panther aggregates and analyzes groups of events in a single detection, so this context is helpful for the post-processing of alerts. You can include any information you’d like here, whether it’s from the relevant event or not.
These events will be transmitted to Tines with a webhook, which can be configured as a Destination within Panther and associated with our Rule either by severity or specifically with a destination override:
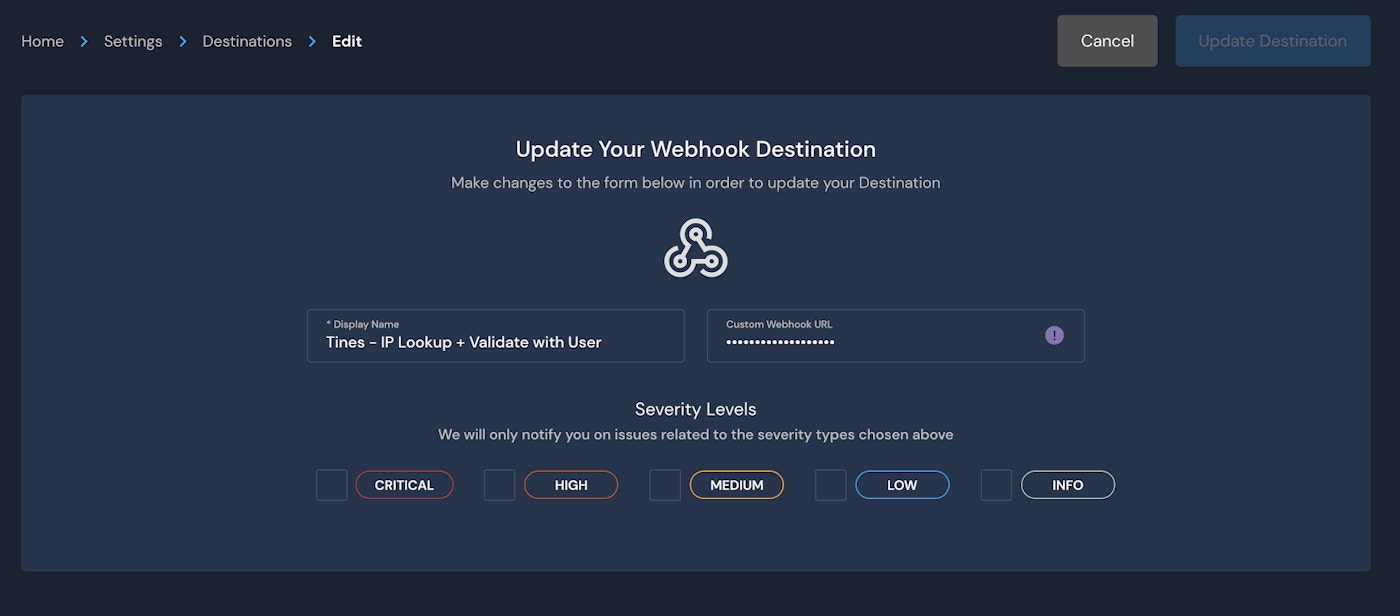
Configure a webhook as an alert destination
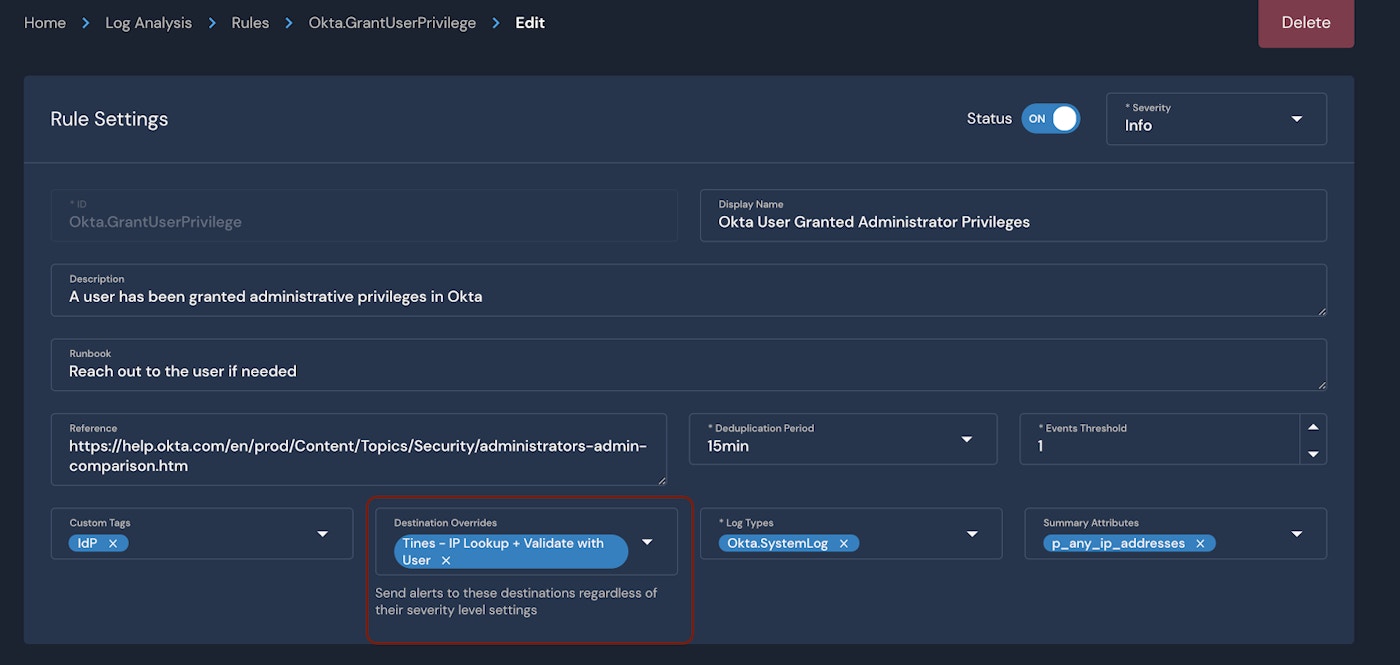
Set an alert destination for a specific rule
Now that all the pieces are in place, let’s take action on this alert with Tines!
Triaging alerts automatically with Tines
The first action item after receiving an alert about privilege escalation may be to ping the user on Slack and ask them to confirm whether the activity was legitimate. If the user responds, “Yes”, then the security team might deem the action authorized and close the alert. If the user responds, “No”, the security team may escalate the incident and lock the affected user’s account.
Additionally, we can also apply a layer of threat intelligence lookups on the IP address. In Tines, workflows can be created to automate this type of incident escalation.
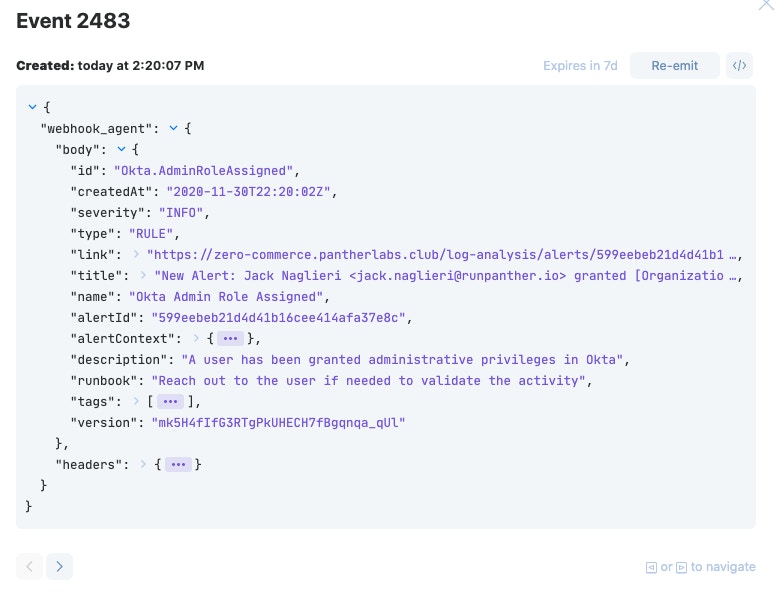
Tines will receive events looking like:
Next, using the drag and drop workflow builder in Tines, we can automate the following remediation actions:
Lookup the client’s IP address in VirusTotal and GreyNoise
If the IP is deemed malicious, ping the user on Slack to confirm their actions
If they don't recognize the action, create a new case in the Hive and lock the account in Okta
If they do recognize the activity, take no additional action
The Story in Tines
If the workflow's predefined requirements are met, then the user will be pinged on Slack to confirm the activity:
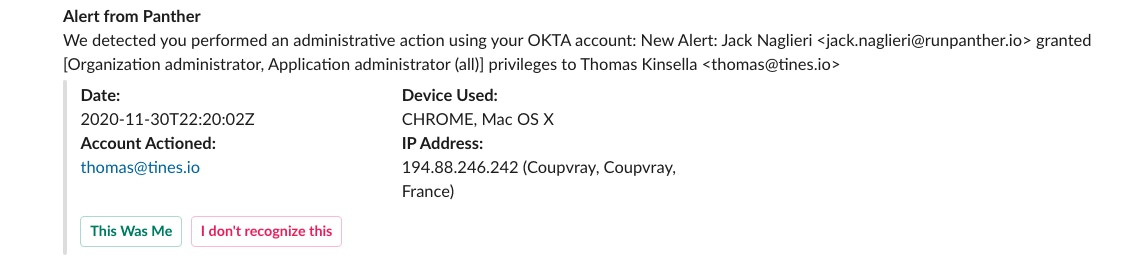
The automated Slack message to confirm the suspicious activity
And if they click, “I don’t recognize this", then a case in the Hive is created, and the user account in Okta is locked out.
This is just one example of a workflow, but the options are endless!
Wrapping up
Maintaining strong security as a company grows can be difficult. This problem is exacerbated by the rapidly growing scale of cloud environments. By applying automation to your security operations, you can reduce manual work, save valuable time, and decrease burnout across your SOC.
Get started today by running Panther and Tines together! Power better security outcomes across your organization and build a robust, end-to-end security pipeline using Python, SQL, and drag-and-drop automation workflows.
Visit the Tines Story Libary to download and customize more Panther and Tines automation workflows.